Tuesday 28 February 2012

Actually I'm not supposed to be trading this week, I'm working on a new business plan for my trading but after I arrived home I spied an opportunity...


Above is my currency divergence chart, you can see here that point A was where EUR/USD confirmed the turn that had already occurred in AUD/USD and AUD/JPY, hence this is where I went short NASDAQ futures.  In addition to this...


This chart above is what I use to compare the NASDAQ to other equity futures markets, so Dow, S&P 500 and Russell 2000.   Again at point A you can clearly see all these markets diverging away from the NASDAQ.   In addition to this my own custom indicator (bottom of next chart) was also diverging markedly lower suggesting a high probability for a turn lower in the NASDAQ.


This was really the perfect set-up, everything I was looking at suggested a short, I was filled at 2631.75 at 18:26.  Market sold off immediately, at a later point 6 points lower within 2 minutes.  Rather than close it I just moved the stop very close to the price, so as to allow continuation, if it came, whilst keeping most of the gains, if it didn't.  It turned out that that was the end of that move.  My stop got taken out at 2621.75 for a 10 point gain.

I'm pleased with that today, got in 0.75 points off the high of the day and took most of the meat that was available on the move.

There was in fact a further opportunity later for a long, but I allowed myself to be distracted, helping Miss Positive Deviant by taking (attempting to take) some pictures of the Aurora Borealis outside.  Many pictures taken, none of them very good (it was quite far away), otherwise I'd have posted it.

Sunday 26 February 2012

More on Dan Ariely;

[youtube]http://www.youtube.com/watch?v=9X68dm92HVI[/youtube]
I'm reading a really interesting book right now, "Predictably Irrational" by Dan Ariely.  I'm only just into it but it shows how context can heavily influence decision making behaviour, particularly financial decisions, leading to illogical choices.


From Wikpedia;

"Predictably Irrational: The Hidden Forces That Shape Our Decisions is a 2008 book by Dan Ariely, in which he challenges readers' assumptions about making decisions based on rational thought.  Ariely explains, "My goal, by the end of this book, is to help you  fundamentally rethink what makes you and the people around you tick. I  hope to lead you there by presenting a wide range of scientific  experiments, findings, and anecdotes that are in many cases quite  amusing. Once you see how systematic certain mistakes are--how we repeat  them again and again--I think you will begin to learn how to avoid some  of them".[1] "

"Dan Ariely (born April 29, 1968) is an Israeli American professor of psychology and behavioral economics.[1] He teaches at Duke University and is the founder of The Center for Advanced Hindsight.[2]"

Friday 24 February 2012


Short entry at 18:15, filled at 2607.75, the market had spent the day in a range to moved stop so breakeven early on, market sold off a few points before rallying up to my stop taking me out at breakeven...

Thursday 23 February 2012

Australian Dollar futures (Daily);


Trendline break


British Pound futures (Daily);


Trendline break


Japanese Yen futures (Weekly)


No trendline break

Friday 17 February 2012


Study other retail traders, what are the common mistakes?

What creates peak performance?

Follow the phantom of the pits.
Took a long at 15:45 trying to play the range, market rallied up slightly, didn't look like it would work, moved stop to breakeven, then market sold off taking out my stop at breakeven.

There was also another trade, shown slightly later, that was an error entry, closed immediately for a 0.5 point hit;


Market seems a bit quiet now what with Op-Ex.

Thursday 16 February 2012

Couple of trades today, first one based on what I thought was a top formation on my currency divergence chart;


First trade stopped out for a 2 point loss, the second stopped out at breakeven.

Wednesday 15 February 2012

Today was quite frustrating, I had a fairly clear picture about what I thought would happen. Namely for the parabola in Apple to peak, then for it to sell off, causing a sell-off in NASDAQ futures. I had thought Apple would get up to $530 and I didn't have any clear divergence showing on my currency divergence chart at the time;


There was clear diverence on my equity market divergence chart however since earlier today I only had it set to show from 14:30 onwards (the open) I didn't see this at the crucial time.


When you think you know what is likely to happen, then it transpires but you don't get a position on due to missing some data that was available to you at the time, that is frustrating.

Still this method of trading is relatively new to me, and after all, this is trading, it's not possible to get it right all the time.

I'm on the right track though.
And not long after I took those screenshots;

Apple Intraday sold off $24 after it hit the intraday high of $526...


Headline of the year award goes to Zerohedge for....


"Newton Is Back As Apple Finally Falls"


Excerpt

"Chatter of a QQQQ rebalance (Apple is up ~50% from the last rebalance compared to 10% for NASDAQ) seems to be stumbling the iEconomy as AAPL goes red. Now, which of the 209 funds will be first out of the door? and which last? Volume is picking up for sure and options (esepcially short-dated) are getting very excited. Of course, broad indices are losing their bid implicitly as ES drops below the pre-China rumor and post-Samaras pop levels. Perhaps it is the recognition that we sold off 7% in a week after the last QQQQ rebalance (April 2011) and the pre-move was nothing compared to this..."
Apple parabola not far from vertical;


Apple VIX bottomed already several days ago;
Currency divergence setup hinted at downside to come;


Went short at 15:09, filled at 2589.50, market sold off down to 2583.50, moved stop to 2589 however market rallied up taking out my stop for a 0.5 point gain.

Tuesday 14 February 2012


Yesterday was a low volume, tight range market with a downside bent, there didn't appear to be many opportunities so I called it a day just into the last hour. Checked it later to see a rather absurd 20+ point stick save rally, massively increased volume in the last half hour, almost like someone flicked a switch. Hmmm.....!

Sunday 12 February 2012

NQ (Emini NASDAQ), ES (E-Mini S&P500), YM (E-Mini Dow) andTF (E-Mini Russell);

This is from 30/12 /11 to present;
Resized to 97% (was 1023 x 624) - Click image to enlarge


You can see that the Russell has clearly stalled, peaking on 3rd Feb, although there is no break of trend yet. The Dow has outperformed the S&P500 for the majority of the rally since the start of the year however this changed on 3rd Feb and it has started underperforming the S&P500.

Friday 10 February 2012

Spotted what looked like a good opportunity to go short at 6.35am, went short;


Closed at 13:30 for a gain of 12 points.


Big move down in Copper today -3%


Pop up in the Dollar Index


Also noticed large blocks of NASDAQ futures changing hands today, running into hundreds at a time, more than I typically see.


The Dollar Index was making a sustained move higher that looked on target to eclipse the recent high at 78.85, the main reason to short the NASDAQ.


I have a couple of extra screens these days, I usually keep the Dollar Index on one and the following on another;

AUD/JPY, EUR/USD, AUD/USD and NQ;


Quite often you can get a lead into how things are going to develop by watching how they interact.


I also watch these futures;

NQ (Emini NASDAQ), ES (E-Mini S&P500), YM (E-Mini Dow) and TF (E-Mini Russell);


Again, it can be interesting watching for divergences.  I find it very interesting, you can see in this chart above that NQ is correlated 1 to 1 with YM at the start of the chart, and this correlation gradually breaks down as the correlation between NQ and ES gradually increases.   Then at 3pm this process reverses, the NQ YM correlation seems to near 1-1 again, right around the high of the day session, before it then breaks down, along with the market in general.


I'm starting to put some of my observations into a new trading plan where I use different types of set up depending on the situation.


Currency market divergence setup

This is a good example showing how the currency markets can lead into turns in the equity markets.  At point A EUR/USD and AUD/USD are diverging downward contrary to the trend in NQ, then at point B the EUR/USD and AUD/USD divergence becomes more marked, then 2 minutes later the turn is signalled by AUD/JPY diverging sharply lower and away from NQ.  This is the point where the new downtrend in equity markets began this day.

And here with a chart of the NASDAQ over the same timeframe;


Currency market convergence setup;


Look at the small rectangle, that's the high of the day.  I've seen this a number of times now where 3 of the 4 converge together very tightly to form an upside down "V" at a top or a V at a bottom, I drew this as it happened that day, and went short not long thereafter, 1 point from the high of the day, using this (although that day it didn't work particularly well since there wasn't much of a sell off thereafter).  It's almost as if at key points the correlations between the markets themselves make a high or low...

Wednesday 8 February 2012

Three trades so far this month;


3rd Feb

Breakeven

7th Feb

0.25 point loss

8th Feb

0.75 point loss

Saturday 4 February 2012

Paradox and Irony

I've not had much time to post or trade recently due to some personal health and legal issues, but they are mostly resolved now, nothing serious.


the Perception of my Psychology

Over time writing a journal I have noticed that quite often I tend to pose questions at turning points, that point to the truth. (for BMT readers note that these are from another forum I post on, but I linked to the original posts)

e.g.


[At the 2011 top in silver]
[quote name='PositiveDeviant' timestamp='1303477647' post='213020']
Is this the type of over-emotional response you might see near some form of top?
[/quote]
from post http://www.greenener...ndpost&p=213020


[On the top in silver marking a top in equity markets]
3rd May 2011
[quote]since Silver's rise could be said to be correlated to excess liquidity in the market, (and it may be finished for now) could this be a general marker for commodities and the equity markets?[/quote]from post http://www.greenener...ndpost&p=214123

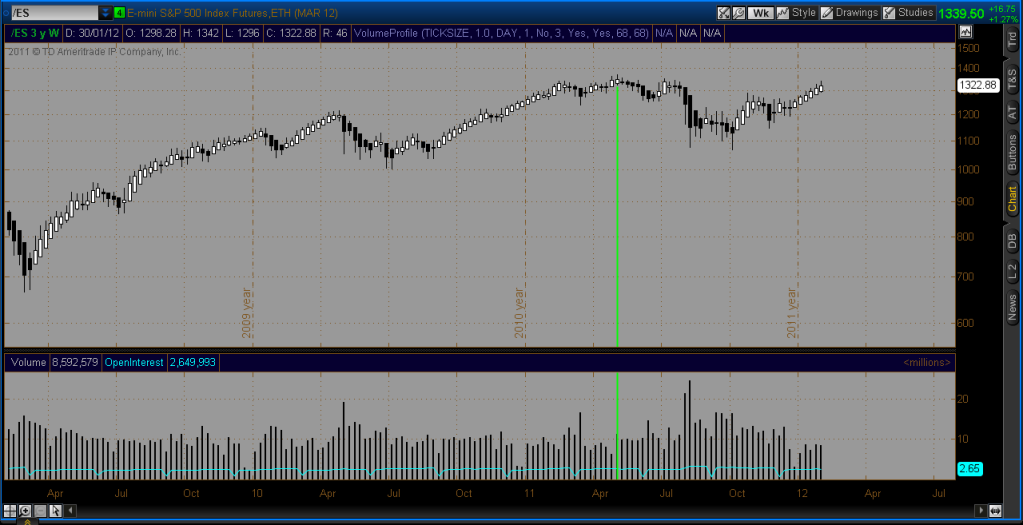
This was one day after the top in the S&P500;
S&P500 futures - weekly chart


[On the sharp dive in Natural Gas]
[quote name='PositiveDeviant' timestamp='1327002035' post='237456']
Is Natural Gas going to hit a low very soon?
[/quote]

from post http://www.greenener...56

It hit a low within two days, although it's not yet clear whether this is a major low.


[On the situation with Silver]
[quote name='PositiveDeviant' timestamp='1325166220' post='235885']
The emotions of silver bulls and North Koreans are correlating 1 to 1 right now.


Surely this must be the low.
[/quote]

post from http://www.greenener...85

And that was the day of the low, although I bought GDXJ instead of silver. This last example was personally very interesting for me since the post was originally intended as a post to mock those holding silver, by suggesting that they were all devastated, since silver had nearly halfed since the top, and many will have held on all the way along. However I realised that since I was correlating silver bulls with North Koreans 1 to 1 , and that since the North Koreans had hit rock bottom with the death of their leader, this was likely to also mean a low for silver. Particularly so as I realised I was becoming engaged in the process of creating a situation with a potentially ironic outcome. If I'd have simply posted the joke, then clearly, paradoxically, the joke would have been on me since by engaging in the process of mocking others, ironically, it would have been done at the expense of exploiting the opportunity.

(There was a lot of abuse hurled at Romans Holiday by those holding silver, and sometimes this was done by people who should have been selling their silver, rather than holding onto it as it declined, whilst trying to make a joke of another. - A similar situation containing paradox and irony.)

It would seem that truth can be found by asking a big question, or by being perceptive to situations that could lead to an ironic outcome.

In some ways it could be viewed that I reversed the paradox (by buying GDJX) to create the opposite of the ironic outcome (making gains as opposed to trying make satircal comedy, and missing an opportunity).

I hope this makes sense to those reading this, it's difficult to explain well.


(There is another element to this that I may write about later and that is the divergence between short and long term outcomes and how these can diverge into complete opposites on a long enough timeline - another paradox)