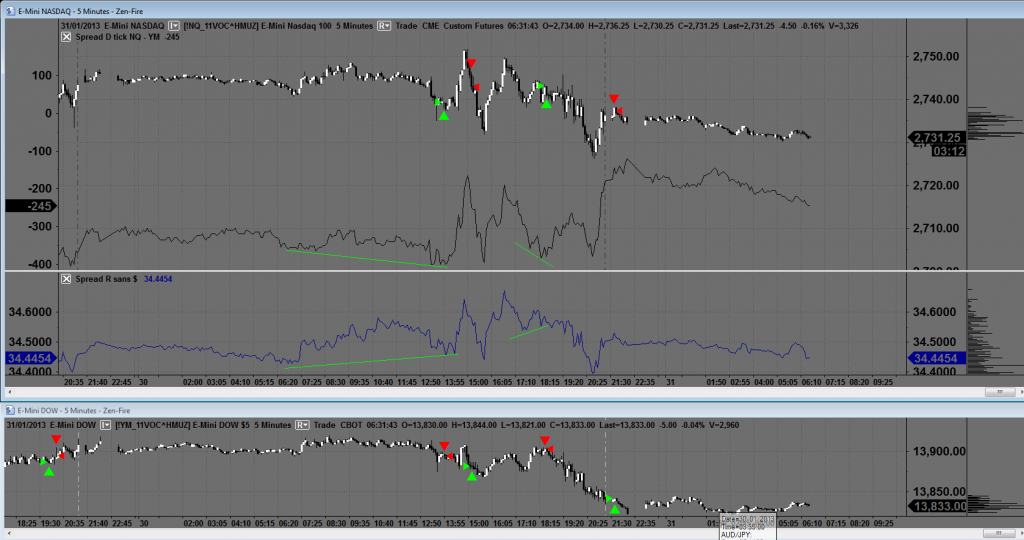
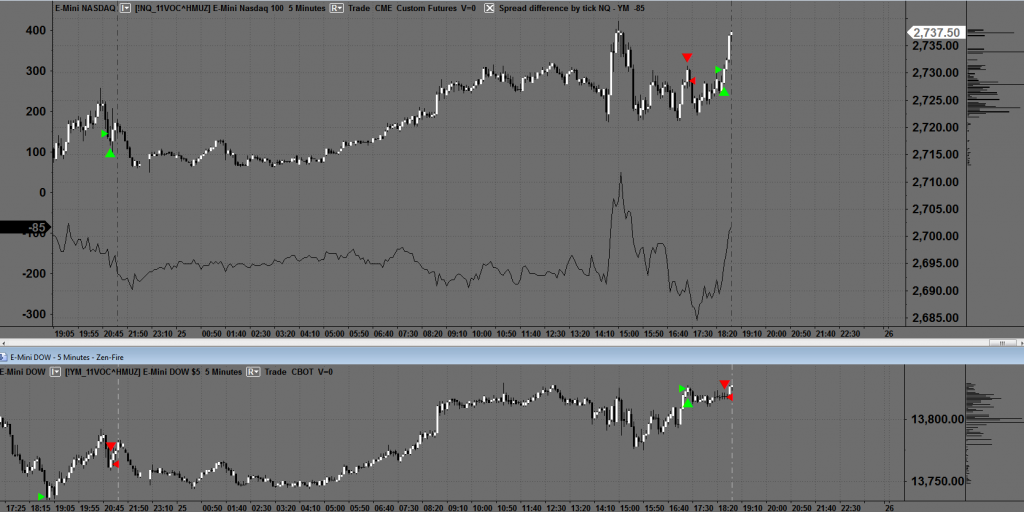
NASDAQ 100 futures on top and Dow Jones futures below
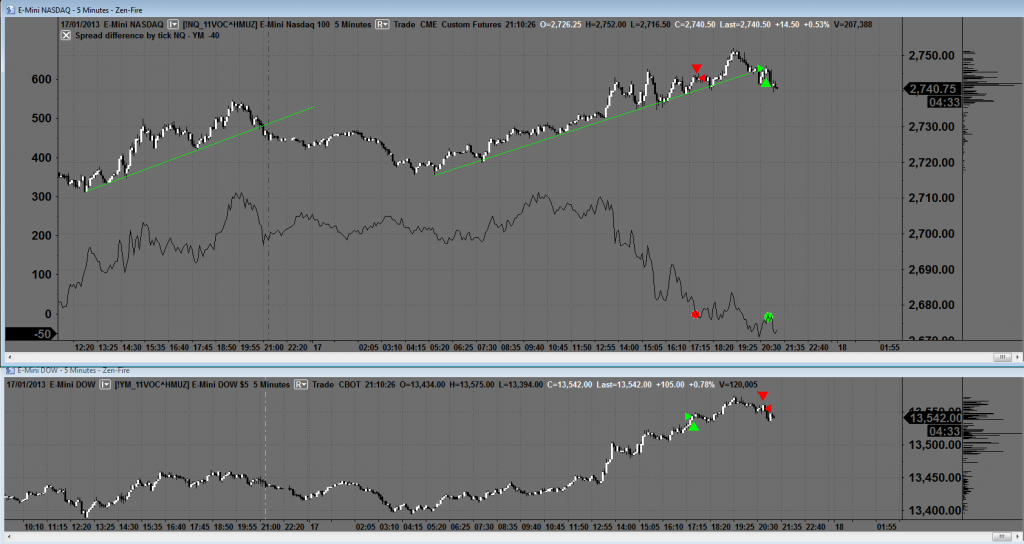 The NASDAQ was going up in a strong trend, I thought it would crack before the close, accentuating the difference in performance for the day between the NASDAQ 100 and Dow Jones futures.
Got into this at 5.30pm and although the spread fluctuated back and forth it didn't continue lower as per earlier in the day, got out before the close for a flat trade. This is a new type of trading I'm exploring where I'm not using stops close to the price. I do have stops but they are 50 - 100 points away from the price of each future, and are simply in place in case I get a power outage / phone lines go down etc.
Although the trendline was broken in the NASDAQ it wasn't in any meaningful way therefore this trade didn't act in the way I thought it might.
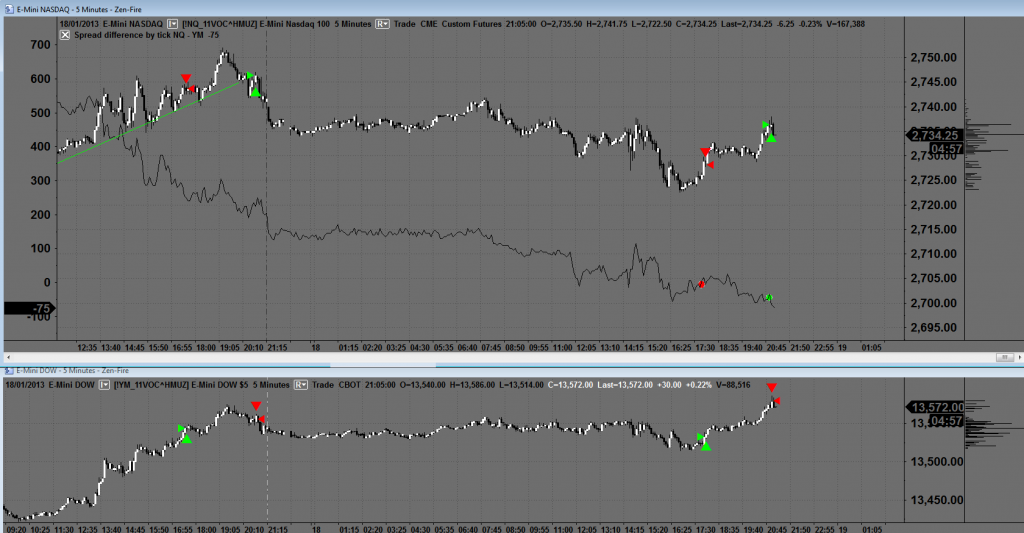
The NASDAQ was going up in a strong trend, I thought it would crack before the close, accentuating the difference in performance for the day between the NASDAQ 100 and Dow Jones futures.
Got into this at 5.30pm and although the spread fluctuated back and forth it didn't continue lower as per earlier in the day, got out before the close for a flat trade. This is a new type of trading I'm exploring where I'm not using stops close to the price. I do have stops but they are 50 - 100 points away from the price of each future, and are simply in place in case I get a power outage / phone lines go down etc.
Although the trendline was broken in the NASDAQ it wasn't in any meaningful way therefore this trade didn't act in the way I thought it might.