
Monday, 29 April 2013
Discretionary trading
It's been a while since I've traded intraday, I seem to be pretty busy but know that I need to make time for it.
I haven't settled on a strategy per se, so in the meantime I'm going to see if I can carve out a style all of my own, using a discretionary approach, something I've not really tried before...
I'll be doing this on a SIM account for now.
Earlier looking at NASDAQ futures compared to EUR/USD, AUD/JPY and AUD/USD some divergence appeared suggesting a potential turn down;
1 month timeframe chart
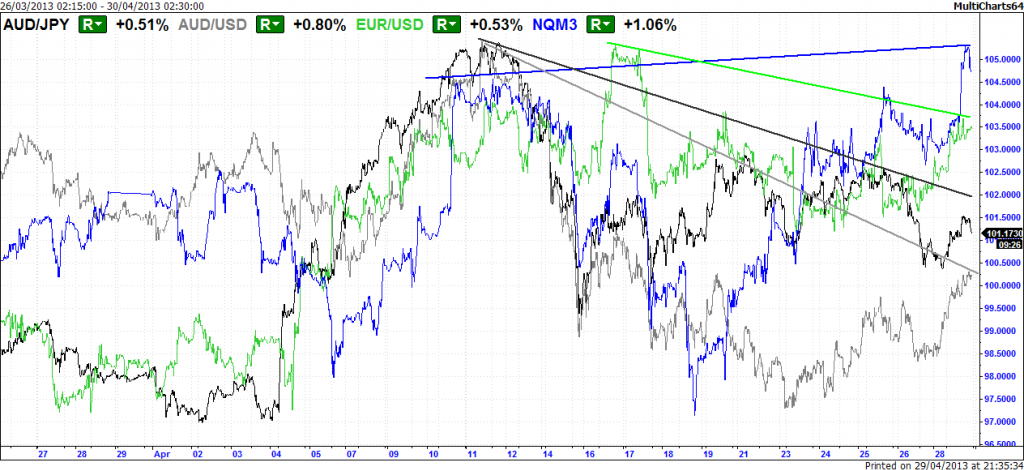
The divergence on the above chart suggested focusing on the downside.
Looking at the intraday chart for NASDAQ futures, I went short on a trendline break at 2868. The NASDAQ was also weakening relative to DOW 30 futures;
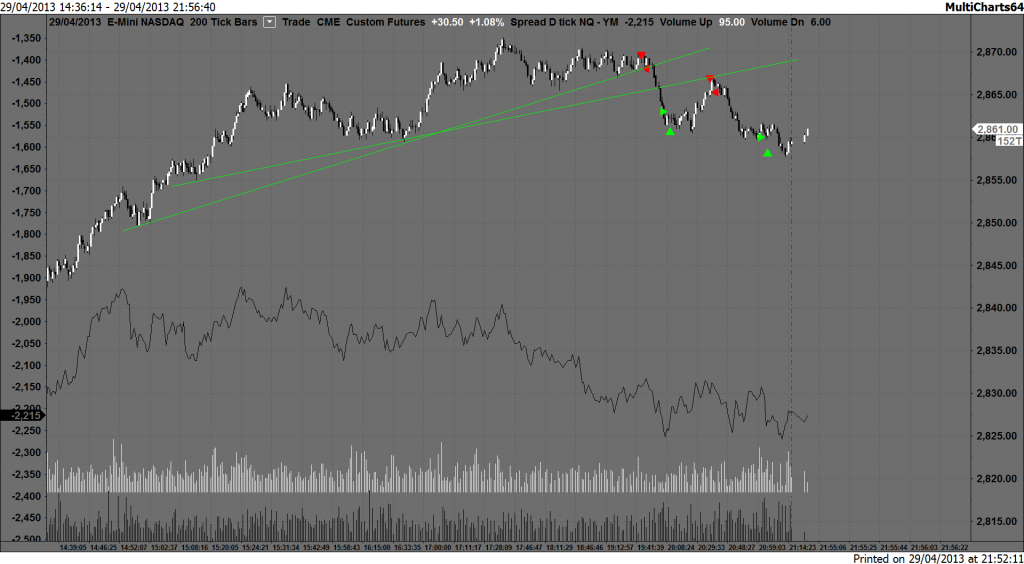
The market sold off 5 points, I closed the position. The market rallied to another area that I felt may offer resistance at 2867, and was rejected by the next trendline therefore I went short again, the market sold off another 5 points before I closed the position.
Up 10 points for the day.
Subscribe to:
Posts (Atom)