
Friday, 19 August 2011
Tuesday, 16 August 2011
Who is the fairest of them all?
Let's be honest, it's more a case of the ugly sisters when we're talking about the Euro and the Dollar. Which of the two ugly sisters would you prefer? Now that's what I call a dilemma.
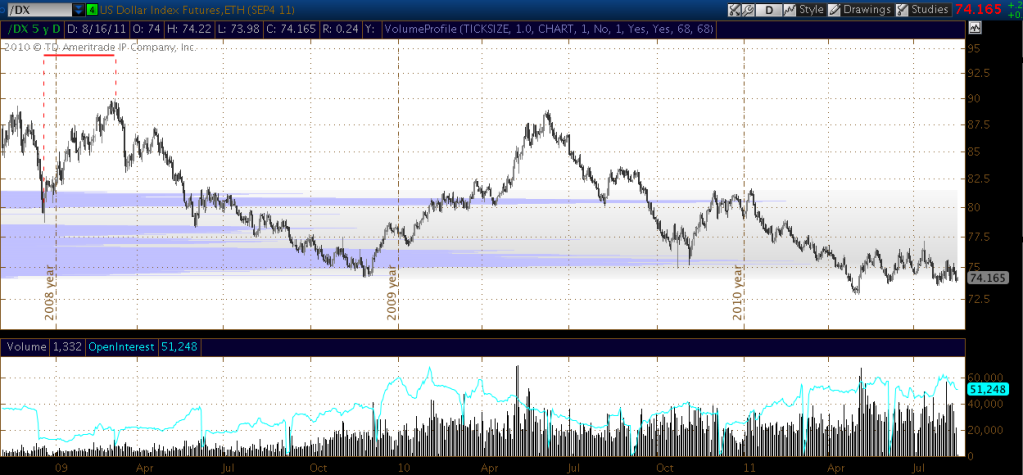
Dollar Index futures;
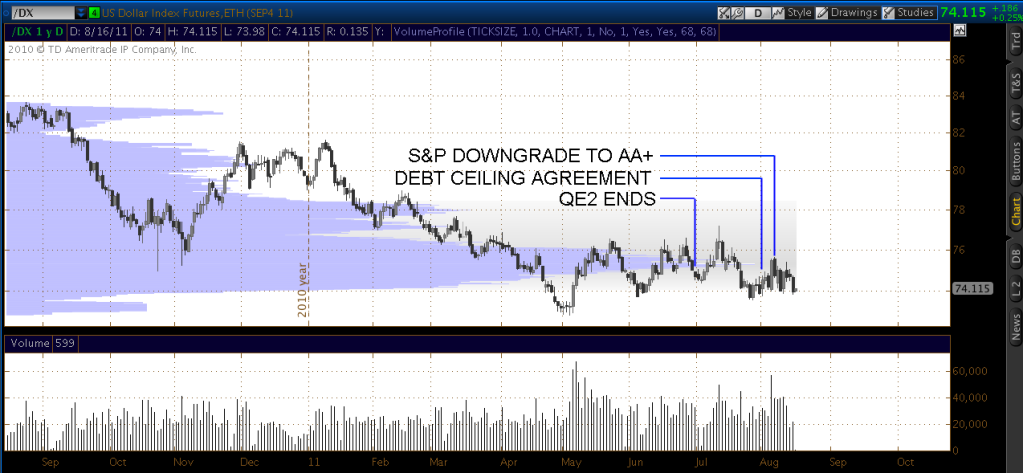
Given the recent travails the dollar seems to have faired reasonably. The debt ceiling farce was pure theatre. The US politicians are not stupid, although sometimes it seems that way. I got an over-riding feeling that under the surface, there was a test of international resolve here. How far can we push? How can we find out what people really think of the US dollar and US treasuries, when it comes to the crunch? Well there is no better way than to turn the debt ceiling into a political football.
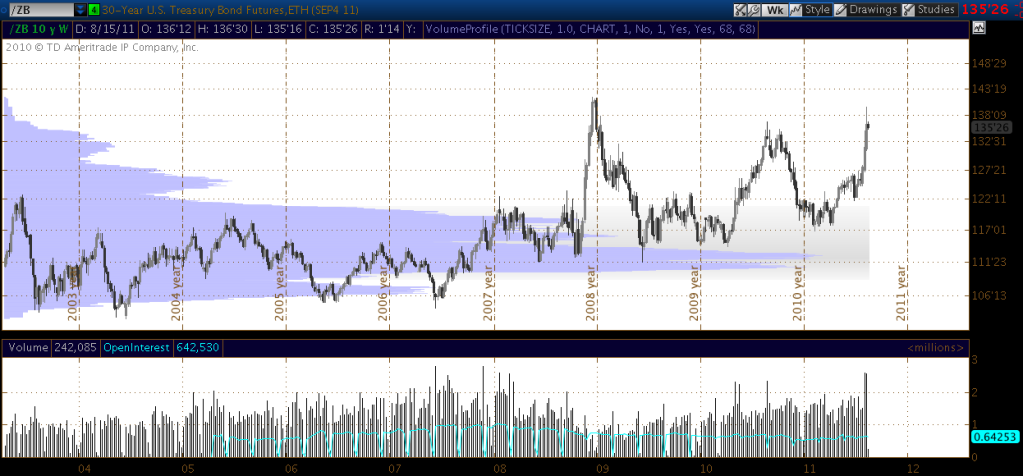
Still, on a longer term chart you could argue the dollar is building a base here;
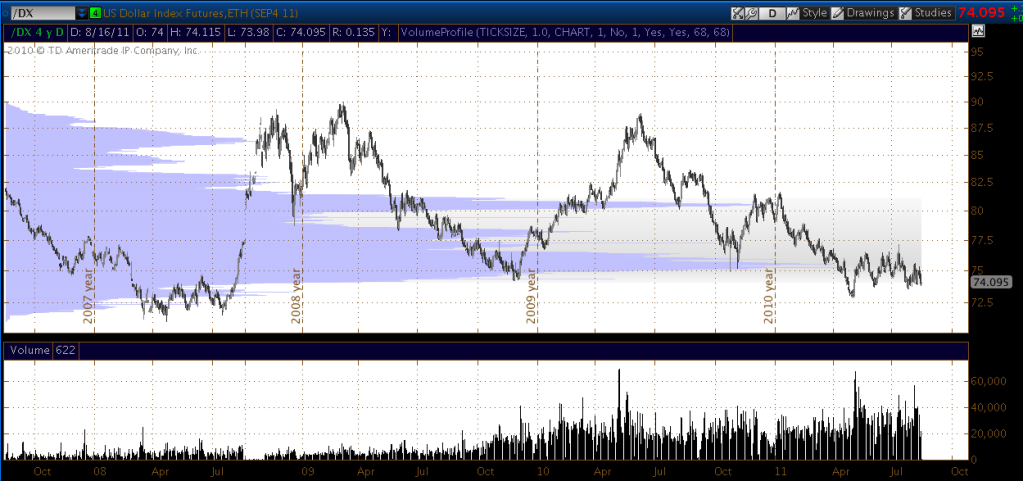
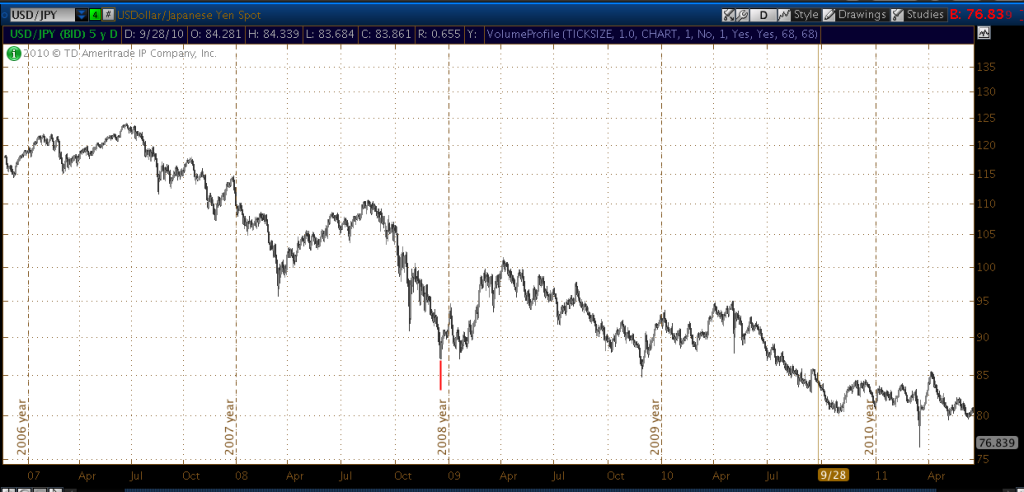
And how about the ugly sister?;
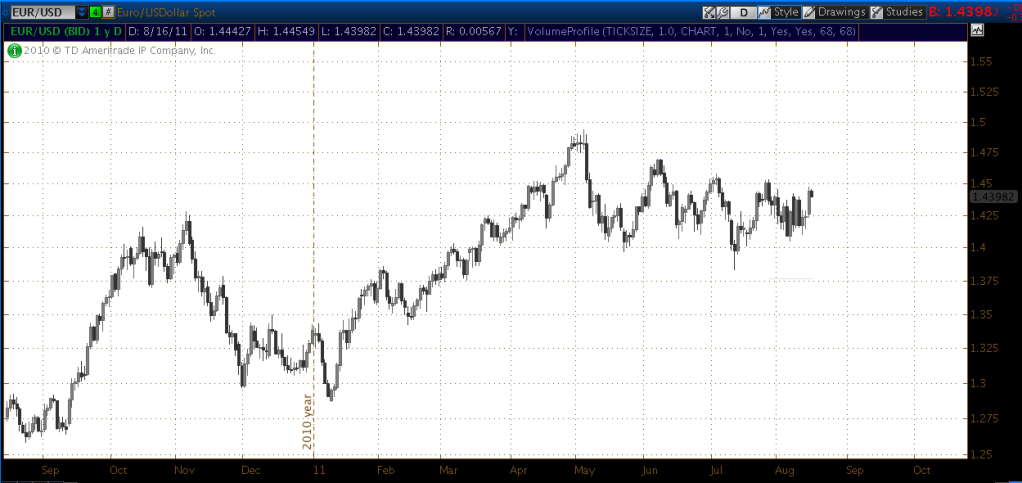
The first word that came to mind here is - Precarious. If I could still trade through ThinkorSwim right now I would be minded to buy some FXE puts here.
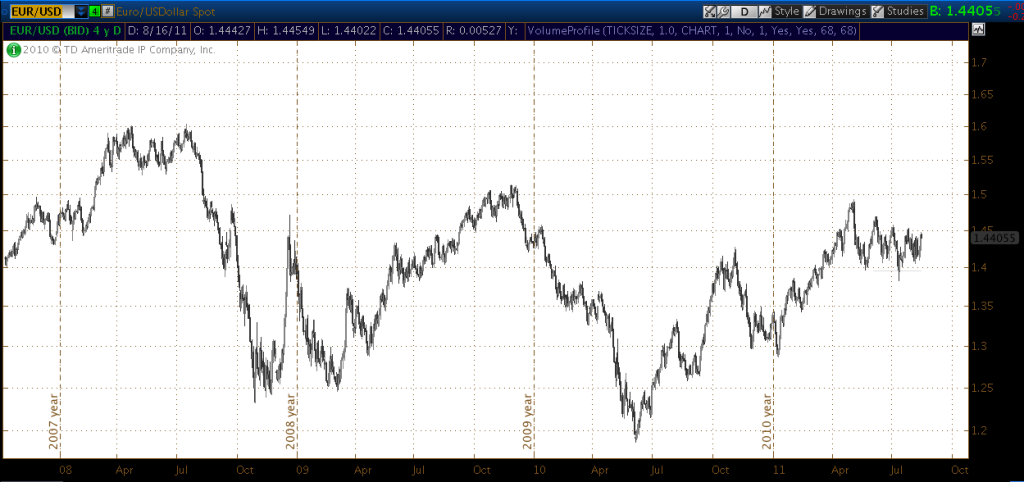
How has this ugly sister aged?;
US dollar sentiment;
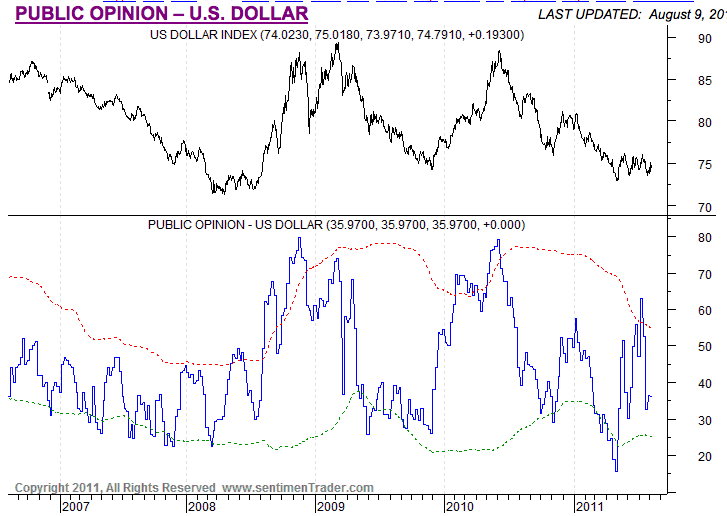
Sentiment made a low of 10 at the start of May.
The Euro is a failed project, sooner or later the market is going to price accordingly.
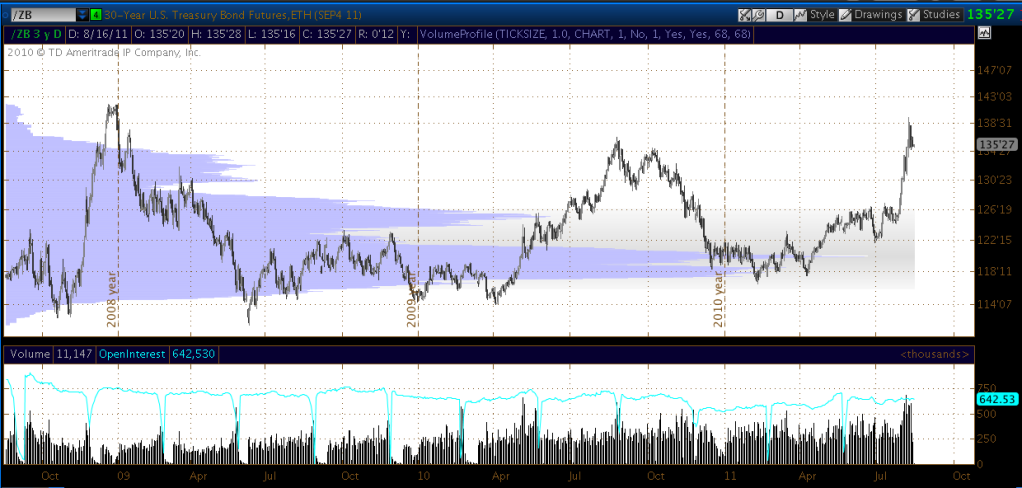
30 year treasuries recently soared up to 140, almost reaching the rarified heights of December 2008;
On a 10 year chart it could almost be a double top;
The 30 year topped on 18th December 2008 at 141'28. That was the day after USD/JPY made a multi-month interim low;
And the Dollar Index?
The Dollar rallied from 78.775 to 89.97 from 18th December 2008 to 9th March 2009.
Maybe we should be watching the 30 year.
Dollar Index futures;
Given the recent travails the dollar seems to have faired reasonably. The debt ceiling farce was pure theatre. The US politicians are not stupid, although sometimes it seems that way. I got an over-riding feeling that under the surface, there was a test of international resolve here. How far can we push? How can we find out what people really think of the US dollar and US treasuries, when it comes to the crunch? Well there is no better way than to turn the debt ceiling into a political football.
Still, on a longer term chart you could argue the dollar is building a base here;
And how about the ugly sister?;
The first word that came to mind here is - Precarious. If I could still trade through ThinkorSwim right now I would be minded to buy some FXE puts here.
How has this ugly sister aged?;
US dollar sentiment;
Sentiment made a low of 10 at the start of May.
The Euro is a failed project, sooner or later the market is going to price accordingly.
30 year treasuries recently soared up to 140, almost reaching the rarified heights of December 2008;
On a 10 year chart it could almost be a double top;
The 30 year topped on 18th December 2008 at 141'28. That was the day after USD/JPY made a multi-month interim low;
And the Dollar Index?
The Dollar rallied from 78.775 to 89.97 from 18th December 2008 to 9th March 2009.
Maybe we should be watching the 30 year.
Monday, 15 August 2011


Sunday, 14 August 2011
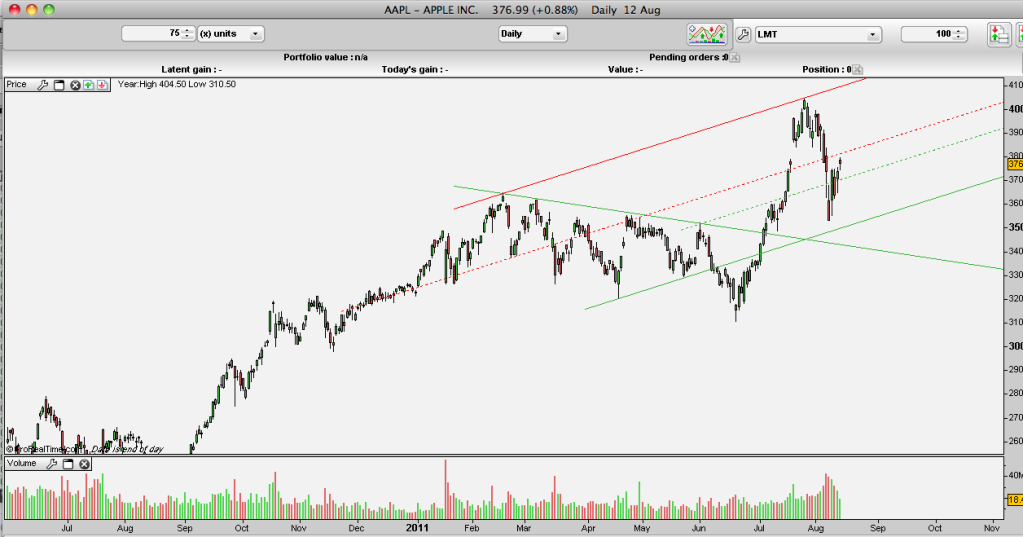
Another chart option;
Another option;
http://www.prorealtime.com
This again, is free, you just need to register and it's web based, using Java again. You only get end of day data for free. It's fast, suggesting it's well written, and it seems quite user friendly. Some nice features such as automated draw of trend-lines, you can also compare performance of various underlyings on one chart (that's what I need).
Apple;
E-Mini NASDAQ, AUD/JPY, EUR/USD, AUD/USD;
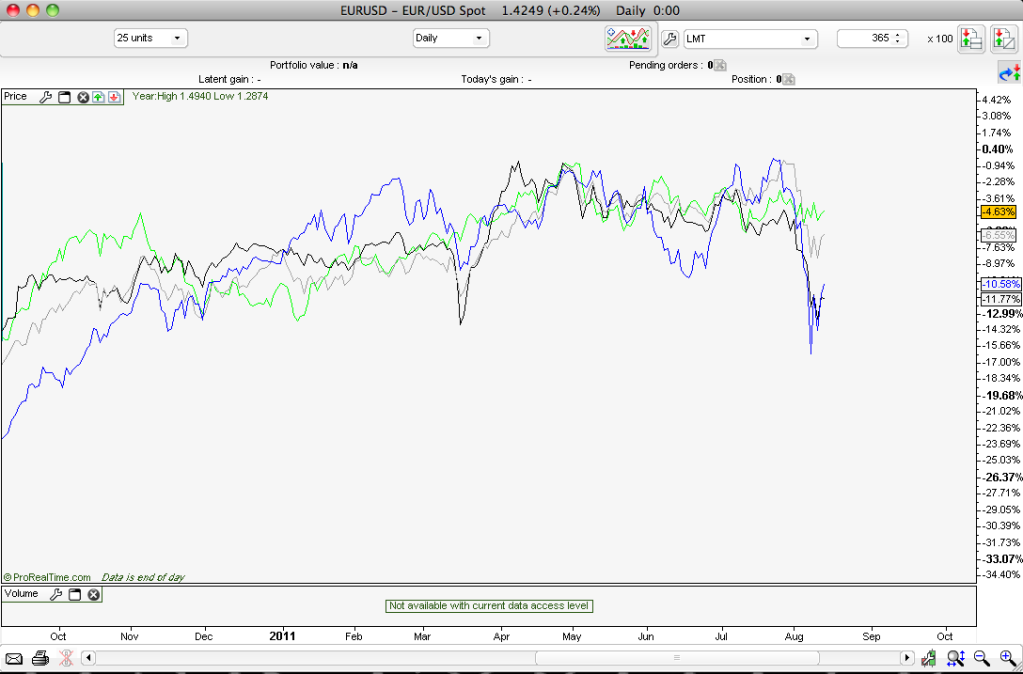
Friday, 12 August 2011
And...today
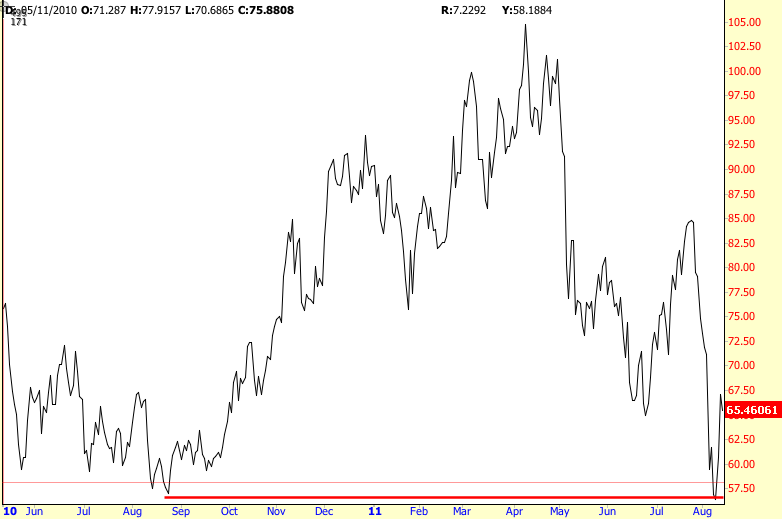
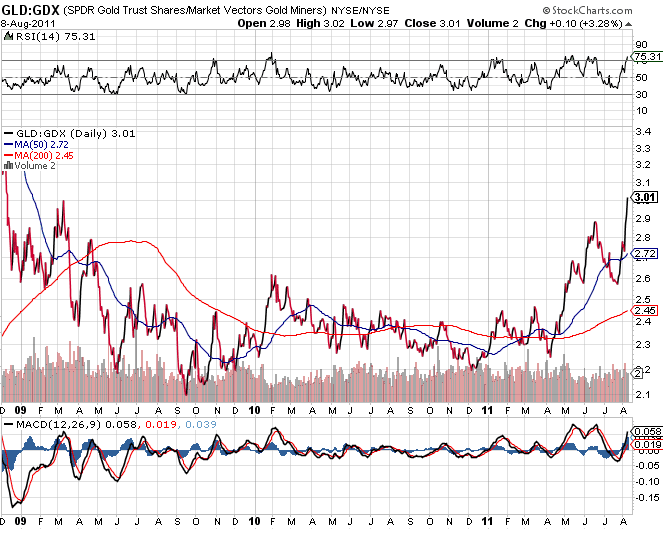
Take a look at the GDX:GLD ratio over at www.stockcharts.com.
The ratio is very close to the level it was back in March 2009....
0.325 looks like the level to watch.
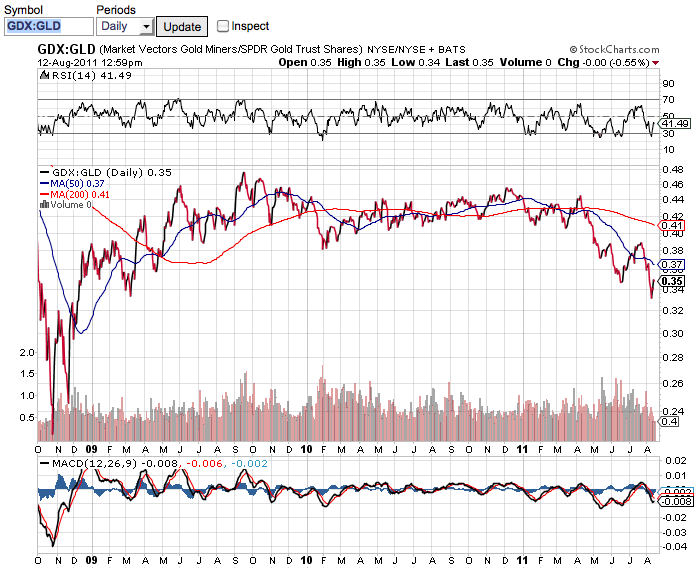
Gold topped on 20th Feb 2009, 2 weeks before the stock market bottomed.
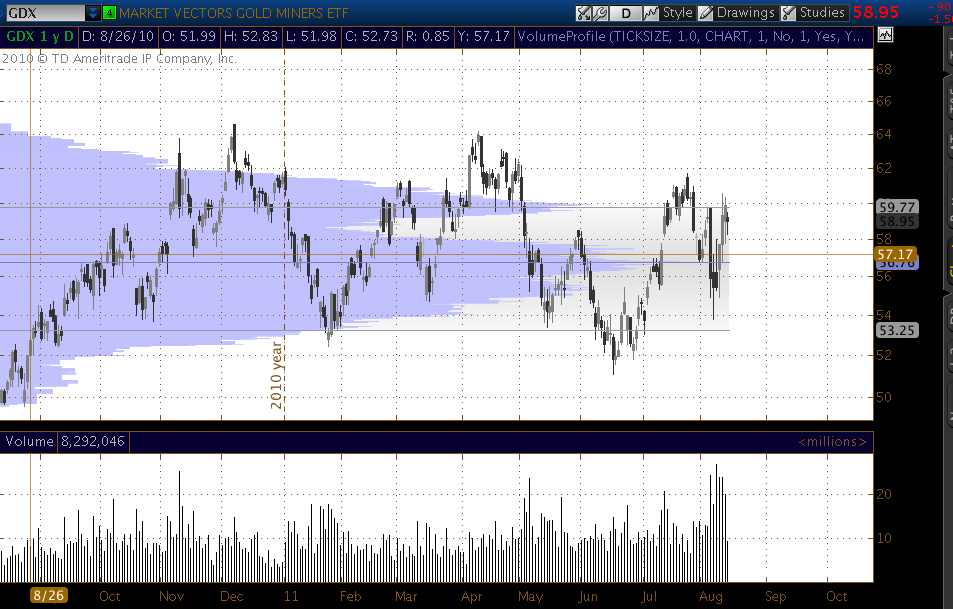
I just checked my proprietary DBDT indicator and it gave a buy signal on GDX by the close of trade on 10th August. That's quite interesting for me since historically my indicator has been reasonably accurate with GDX.
GDX buy signal 10th August;
GDX 1 year;
Also a buy signal on XAU (Gold/Silver index)
If gold remains at elevated levels and crude remains suppressed then I would certainly think there is a strong chance of a very large upward breakout for the gold miners.
The ratio is very close to the level it was back in March 2009....
0.325 looks like the level to watch.
Gold topped on 20th Feb 2009, 2 weeks before the stock market bottomed.
I just checked my proprietary DBDT indicator and it gave a buy signal on GDX by the close of trade on 10th August. That's quite interesting for me since historically my indicator has been reasonably accurate with GDX.
GDX buy signal 10th August;
GDX 1 year;
Also a buy signal on XAU (Gold/Silver index)
If gold remains at elevated levels and crude remains suppressed then I would certainly think there is a strong chance of a very large upward breakout for the gold miners.
Yesterday
After some searching online yesterday I found out that ThinkorSwim license an abridged version of their platform to the CBOE for papertrading, and it's free to use after registering your email address;
http://www.cboe.com/...papermoney.aspx
The data is delayed but at least this means I can still use their chart tools for end of day analysis. It also comes with ProphetCharts and I've already saved some of my indicators into it, I won't be able to use them to trade intra-day though, due to the delay.
It's quite a relief to have found this. It's not possible to save the chart settings on the main chart function so I'll just have to keep it open all the time so I'd don't have to change the darn settings every time I want to use it.
This is from the CBOE's web based "Paper Money" platform:
Gold futures;
Why couldn't the guys at ThinkorSwim tell me about this?
I asked them the specific question -
"Is there any way I can access a demo account from the UK?"
"No sir, there is not."
Wednesday, 10 August 2011
A new set-up on the way
I contacted Investools last night, they advised I would be able to take Prophet charts separate from the platform (contrary to what ThinkorSwim told me) as part of their Investools package. They want $700 up front then $59 per month and unbelievably they told me they couldn't guarantee the data-feed quality. I didn't even ask about data-feed quality, they just threw that in at the end of their sales pitch. I've heard many complaints from people about the ThinkorSwim data quality and speed and experienced it myself using Prophet charts so I take all of this as a sign to move my business elsewhere. Over at www.bigmiketrading.com (BMT) Mike and another poster has advised I should be able to do what I need using a platform called NinjaTrader so I've applied for an account today with Mirus Futures. The data feed is Zen-Fire. These three came out top in a survey BMT held looking at the best futures broker, platform and data-feed for 2010, so although it doesn't feel like it right now it looks like I'll end up with a more professional set-up specifically geared to futures trading.
I'll need to learn how to program my indicators on the platform and it's PC only so I'll need to look at PC emulation software for my Mac. I'm anticipating a few caffeine induced late night hair pulling sessions before I'm geared up to trade again. I'm also on holiday in Nice with Miss PositiveDeviant for 2 weeks from the 19th August so it's likely to be a little while before I'm trading again.
I'll need to learn how to program my indicators on the platform and it's PC only so I'll need to look at PC emulation software for my Mac. I'm anticipating a few caffeine induced late night hair pulling sessions before I'm geared up to trade again. I'm also on holiday in Nice with Miss PositiveDeviant for 2 weeks from the 19th August so it's likely to be a little while before I'm trading again.
Tuesday, 9 August 2011
Devastated
Well I was having a fine day until earlier on. I tried to place some trades and a this message advising - "REJECTED - You cannot open new positions with this account". I thought it was some tech problem with ThinkorSwim. Then they sent me this message;
[quote]We Are Discontinuing Brokerage Operations, We want you to know that after careful consideration, we have made the difficult business decision that we will no longer be able to conduct brokerage operations in the United Kingdom, effective August 8, 2011. Unfortunately, that means you will have to transfer your brokerage business to another firm prior to August 22, 2011; otherwise, we will need to liquidate and close your account ending in ******* on that date. Please accept our sincere regrets for any inconvenience this may cause you. What you need to know: Effective on August 8, 2011, your account will be restricted to closing transactions only. You will not be able to open any new positions or provide additional funding to your account (unless you must meet a margin call).On August 22, 2011, if you have not yet arranged to transfer your holdings to another brokerage firm, we reserve the right to begin liquidation and close your account.We know that this decision may be causing an inconvenience for you thus where applicable thinkorswim by TD Ameritrade will assist you by paying for account closure fees or assisting with the cost of your wire transfer fee. Please let us know if we can assist you with this process. For more information, or if you have any questions, please contact us at support@thinkorswim.com. We are available 24 hours a day, seven days a week. Please know that we fully appreciate your past business and regret any inconvenience this may be causing you.Sincerely, thinkorswim by TD Ameritrade thinkorswim, Division of TD Ameritrade, Inc., member FINRA/SIPC/NFA. TD Ameritrade is a trademark jointly owned by TD Ameritrade IP Company, Inc. and the Toronto-Dominion Bank. Copyright 2011 TD Ameritrade IP Company, Inc. All rights reserved. Use with permission. www.thinkorswim.com This e-mail is sent by a financial firm and contains information that may be privileged and confidential. If you are not the intended recipient, please delete the e-mail and notify us immediately. The risk of loss in trading securities, options, futures and forex can be substantial. Clients must consider all relevant risk factors, including their own personal financial situation, before trading. Options involve risk and are not suitable for all investors. See the Options Disclosure Document: http://www.optionscl...cter-risks.jsp. A copy can be requested via email at support@thinkorswim.com or via mail to 600 W. Chicago Ave., #100, Chicago, IL 60654-2597. Trading foreign exchange on margin carries a high level of risk, as well as its own unique risk factors. Forex investments are subject to counter-party risk, as there is no central clearing organization for these transactions. Please read the Forex Risk Disclosure (http://www.nfa.futur...brary/forex.pdf) before considering the trading of this product. A forex dealer can be compensated via commission and/or spread on forex trades. TD Ameritrade is subsequently compensated by the forex dealer. Futures and forex accounts are not protected by the Securities Investor Protection Corporation (SIPC). Supporting documentation for any claims, comparisons, recommendations, statistics, or other technical data, will be supplied upon request. thinkorswim, Division of TD Ameritrade, Inc. Member SIPC FINRA NFA 2011 © TD Ameritrade IP Company, Inc.
[/quote]
It's not such a big deal having to switch broker, I'm sure I can find one with better commissions and faster data-feed (ThinkorSwim is quite slow sometimes). What is a massive blow is the loss of ProphetCharts. ProphetcCharts is program within the ThinkorSwim platform that allows you to create an indicator based on a formula or a ratio. All my indicators that I created about a year ago are calculated and displayed using Prophetcharts. They were developed on Prophetcharts. I had thought Prophetcharts was owned by a separate company and that ThinkorSwim built their program into the ThinkorSwim platform but TD Ameritrade (**** them) now also own Prophetcharts and I've been told I will not be able to use this any longer. From 22nd August I will no longer have access to my indicators - I can't believe it. I'm not sure what I'm going to do yet. I have grave doubts that I will find another platform that will be capable of plotting my indicators. I am a member of another forum www.bigmiketrading.com, it's full of traders with programming experience so maybe they can help me find something that will be able to do what I need.
Devastated.
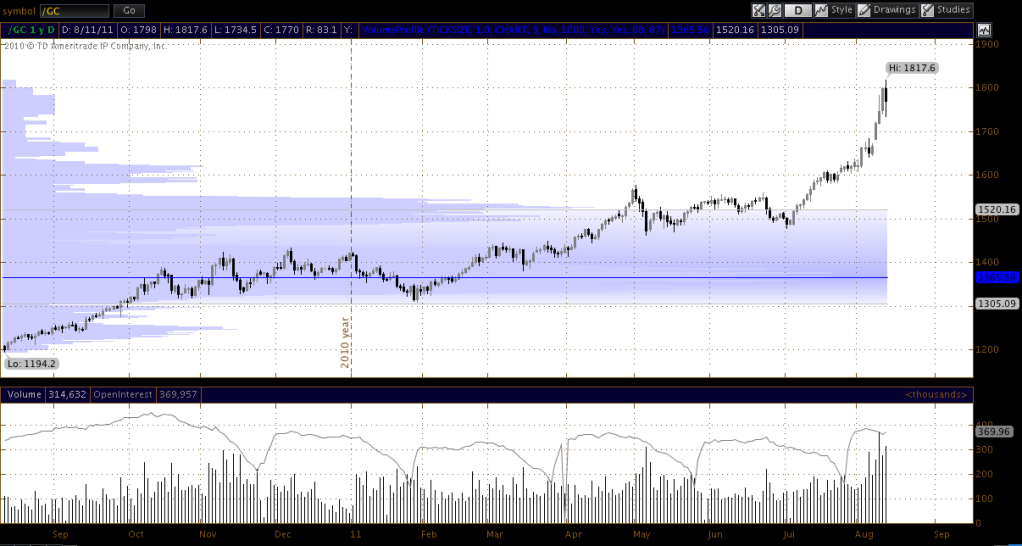
On checking gold futures this morning, they spiked to $1774.80, and are now slightly lower at $1761.
Gold futures - 1 year chart non log;
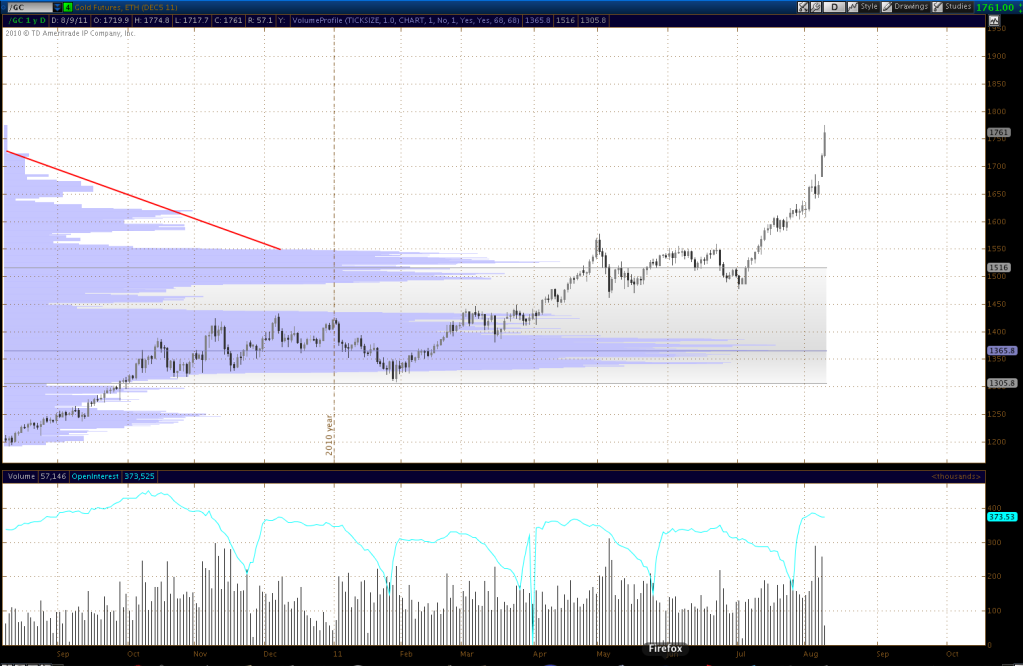
What this chart shows is volume, both in standard format at the bottom of the chart, along with volume plotted in profile across price in blue. The further the blue is to the right of the chart for a given price level, the higher the volume has been at that price level.
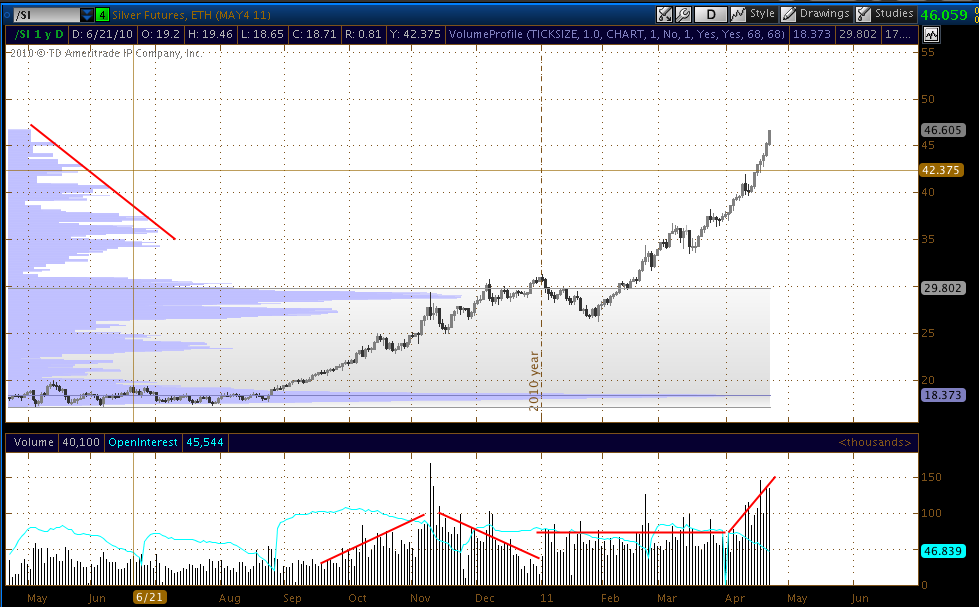
There are similarities between the chart above, and a chart I posted of Silver futures on 21st April this year on the "$50-ish Peak in Silver Coming? Hunting the Top" thread.
Silver futures - 1 year non log (21st April 2011);
On the log chart the move is quite striking.
Gold futures - 1 year log;
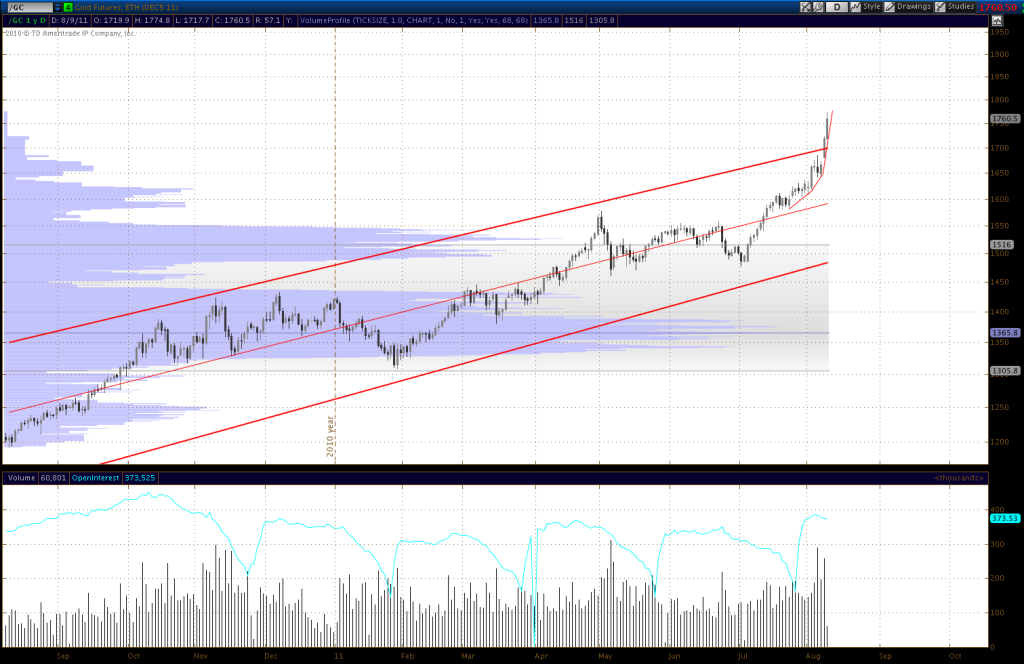
Similarities to the parabola we saw in silver?
CBOE gold volatility;
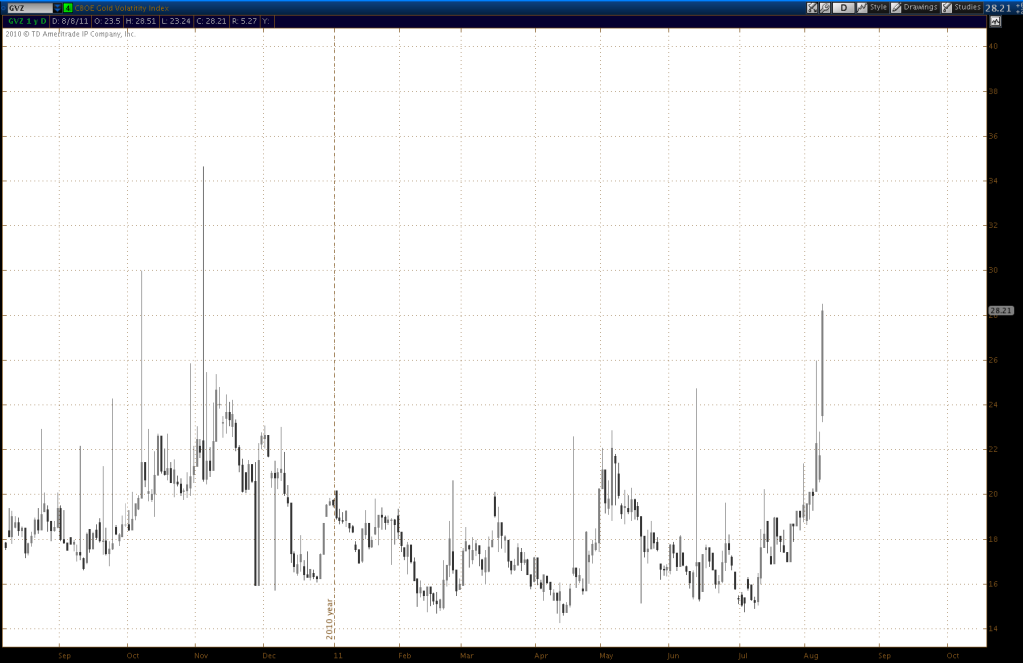
This volatility chart is up to date as of yesterday's close. on 3rd November 2010 Gold volatility spiked to it's high of the year, this preceeded a 5.6% move higher in gold over the following 4 days before a $95 correction.
The GLD/GDX ratio is at the same level as it was during the bottom in stocks on 6th March 2009;
Realistically a $100 correction in gold would not be a surprise given the nature of the rise.
Also;
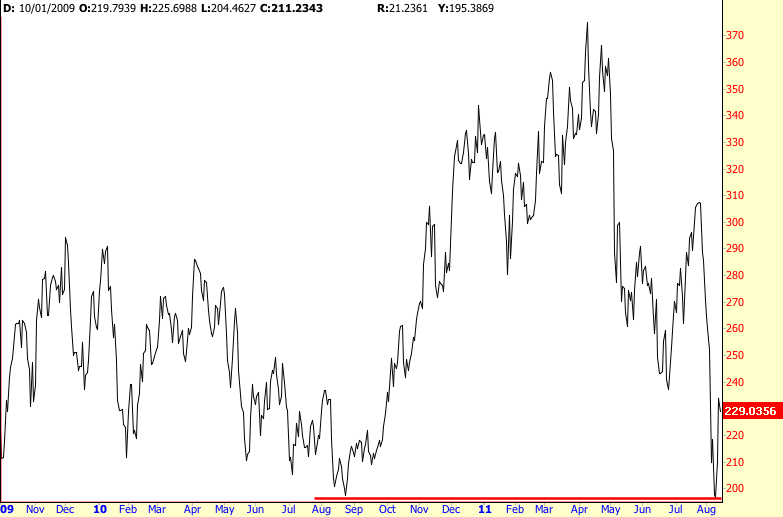
This is the ratio of (30 year treasury bond futures / E-Mini Gold futures) - 2 year;
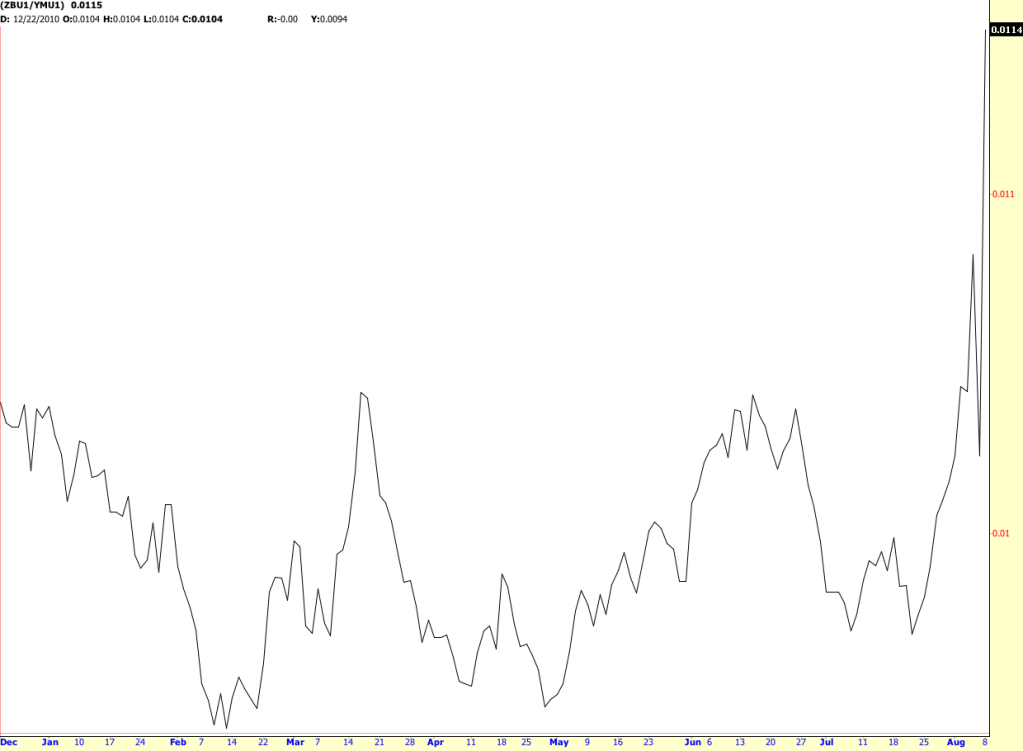
Since the correction in stocks started Gold is massively outperforming 30 year treasuries. Surprise CME margin hikes on gold could temporarily resolve that "problem" for the US Govt.
Gold futures - 1 year chart non log;
What this chart shows is volume, both in standard format at the bottom of the chart, along with volume plotted in profile across price in blue. The further the blue is to the right of the chart for a given price level, the higher the volume has been at that price level.
There are similarities between the chart above, and a chart I posted of Silver futures on 21st April this year on the "$50-ish Peak in Silver Coming? Hunting the Top" thread.
Silver futures - 1 year non log (21st April 2011);
On the log chart the move is quite striking.
Gold futures - 1 year log;
Similarities to the parabola we saw in silver?
CBOE gold volatility;
This volatility chart is up to date as of yesterday's close. on 3rd November 2010 Gold volatility spiked to it's high of the year, this preceeded a 5.6% move higher in gold over the following 4 days before a $95 correction.
The GLD/GDX ratio is at the same level as it was during the bottom in stocks on 6th March 2009;
Realistically a $100 correction in gold would not be a surprise given the nature of the rise.
Also;
This is the ratio of (30 year treasury bond futures / E-Mini Gold futures) - 2 year;
Since the correction in stocks started Gold is massively outperforming 30 year treasuries. Surprise CME margin hikes on gold could temporarily resolve that "problem" for the US Govt.
Nearly, but not quite
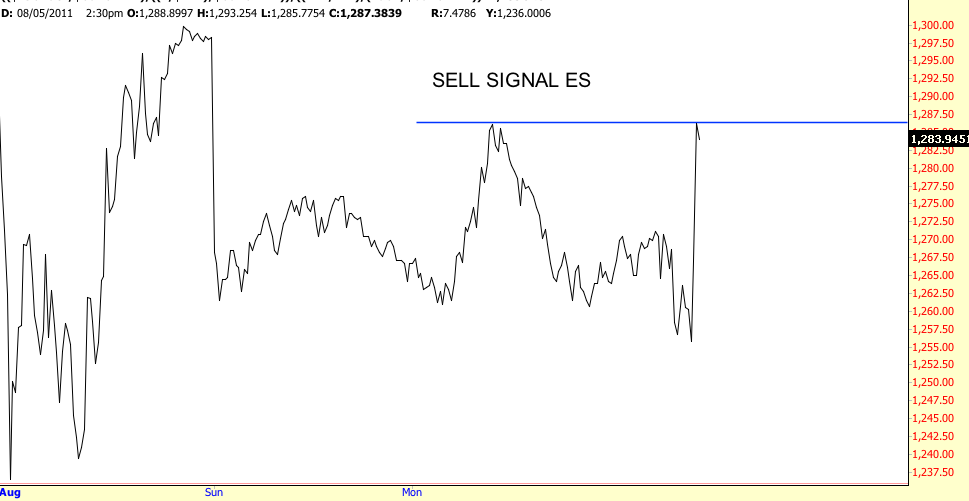
Sell signal on E-Mini S&P futures at 14:45 yesterday;
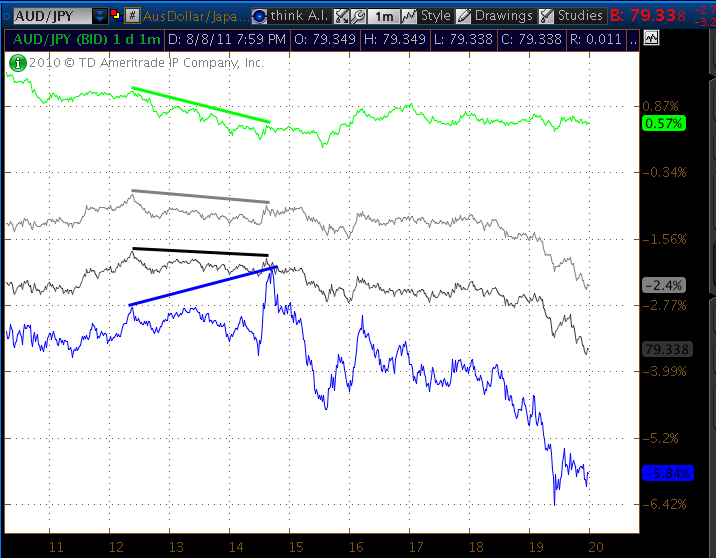
Also clear divergence between E-Mini NASDAQ and key currency pairs;
E-Mini NASDAQ, AUD/JPY, EUR/USD, AUD/USD
Issues with connectivity meant I didn't go short until 14:47, filled at 2147.75, the market continued selling off before spiking up to 2150.75, taking out my 8 point trailing stop for a 1 point loss. Very unlucky, I was kicked off the sell-off due to the volatility. The sell signal came at the perfect spot but the volatility took me out. If I get another short signal in the coming days I'll just use a fixed stop rather than a trailing stop, in order to counter this type of event.
Entry and exit;
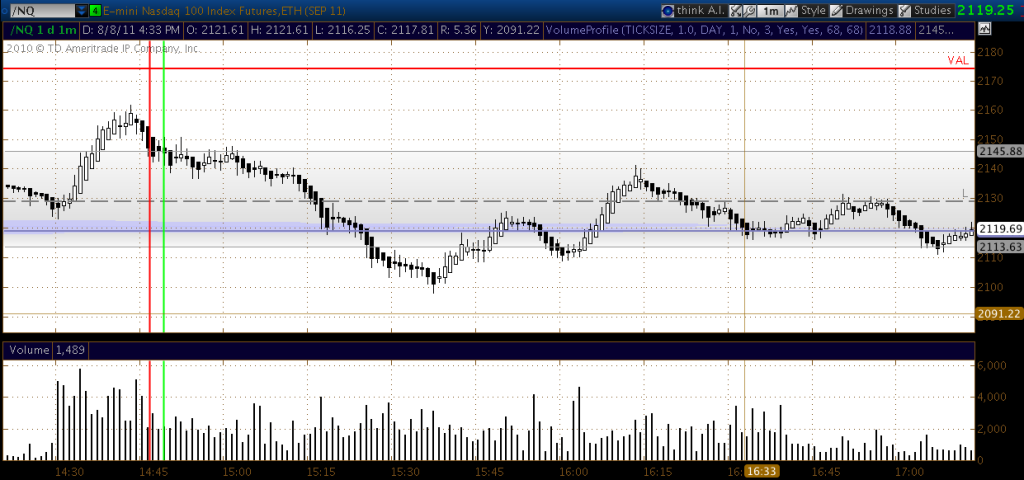
It was a near 50 point sell off following the entry...
Also clear divergence between E-Mini NASDAQ and key currency pairs;
E-Mini NASDAQ, AUD/JPY, EUR/USD, AUD/USD
Issues with connectivity meant I didn't go short until 14:47, filled at 2147.75, the market continued selling off before spiking up to 2150.75, taking out my 8 point trailing stop for a 1 point loss. Very unlucky, I was kicked off the sell-off due to the volatility. The sell signal came at the perfect spot but the volatility took me out. If I get another short signal in the coming days I'll just use a fixed stop rather than a trailing stop, in order to counter this type of event.
Entry and exit;
It was a near 50 point sell off following the entry...
Saturday, 6 August 2011
Concentrate
My primary flaw at the moment is concentration. Sometimes I have missed signals to trade whilst reading/watching news, going away from the screens for a few minutes or whatever it may be. There are far too many times when I miss signals. Had I taken all of the signals available on my indicators since the start I would be up by several orders of magnitude. I've been following a brilliant blog by another daytrader - http://bankrobbertrades.blogspot.com.
It's a rich and varied resource detailing many aspects of what it takes to be a successful trader. Some time ago I wrote about the market being like a mirror.
"The thoughts, emotions, and beliefs of all market participants are collected together and expressed in the form of price. A continuous stream of opportunity and risk. A perfect reflection of reality.
Many have hopes that x will continue higher, their collective thoughts are expressed in the form of price, their hopes may be overwhelmed by the fears of the sellers, wave after wave of sellers can overtake the hopes of the buyers, forcing the prices down, reinforcing the price, reflexively reinforcing the fears of the sellers.
The market is nothing but a mirror. And, if you look hard, you will see your reflection in it. A reflection of your beliefs, your emotions, your hopes, your fears, all reflected back at you. It reflects the collective mind but also the individual mind, and that is what makes it so fascinating."
But also the market is a teacher. James Dines stated an old Wall Street saying that the market will find your weaknesses. It's very true, the market shows you your weaknesses, it throws down the gauntlet and challenges you to face them head on, and overcome them.
The blog linked about includes a link to a book by Theron Q Dumont - The Power of Concentration. Looking very useful so far.
Friday, 5 August 2011
Volatility
The markets were like a schizophrenic bipolar monster that forgot to take his medicine - crazy, volatility was off the scale.
The nonfarm payrolls number was released at 13:30 (BST), I was on the train on my way home from work, it came in at 117K, 26K higher than expected.
The NASDAQ futures moved in a 42.25 point range inside 1 minute, an excellent example of why trading in front of news is a bad idea. Anyone short into that would have got blown away almost instantly.
Today was a rollercoaster of a day for the markets, VIX spiked up to 39.25, last seen in 2008/09 during the credit crisis.
Anyone trading amid this volatility must be crazy.
I had three trades today;
The first was what I thought looked like an opportunity to get onboard a developing flash crash. The E-Mini NASDAQ had been as low as 2180 in pre-market trading. The nonfarm payrolls number catapulted the NASDAQ from 2197 to 2239.25 at 13:30, the market then sold off down to 2211 before rising back up to touch the 2239 level. There then followed a strong bout of selling that got progressively steeper and steeper and steeper, I didn't want to miss a ring-side seat to a flash crash so I went short at 2179.50, the market kept selling off down to 2172 and stopped dead, I moved my stop to 2177.25 so I would at least get something out of if, the market rallied sharply taking out my stop for a 2.25 point gain.
Entry and exit (First red/green vertical lines)
I then had a sell signal on E-Mini Dow Jones futures at 19:00;
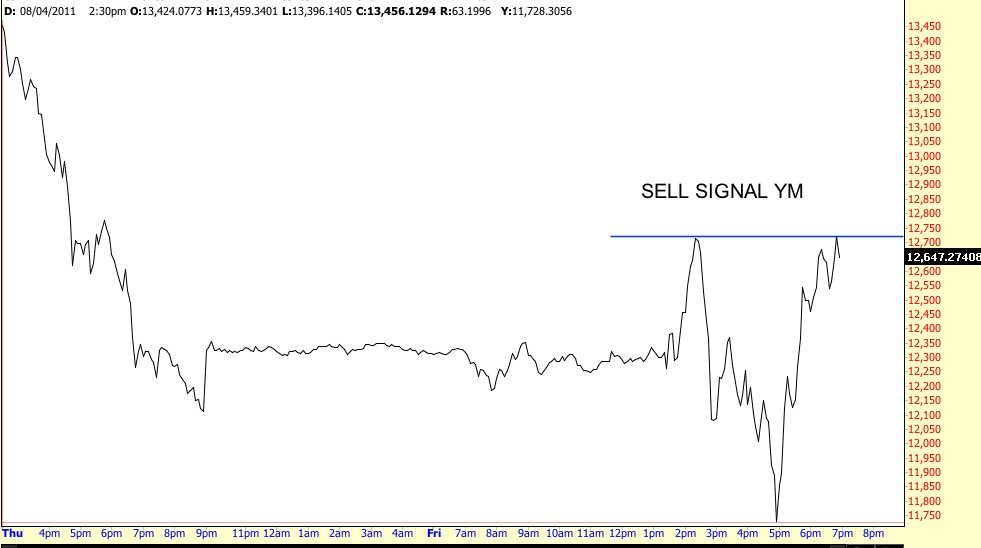
There were also sell signals on SPY and DIA at the same time.
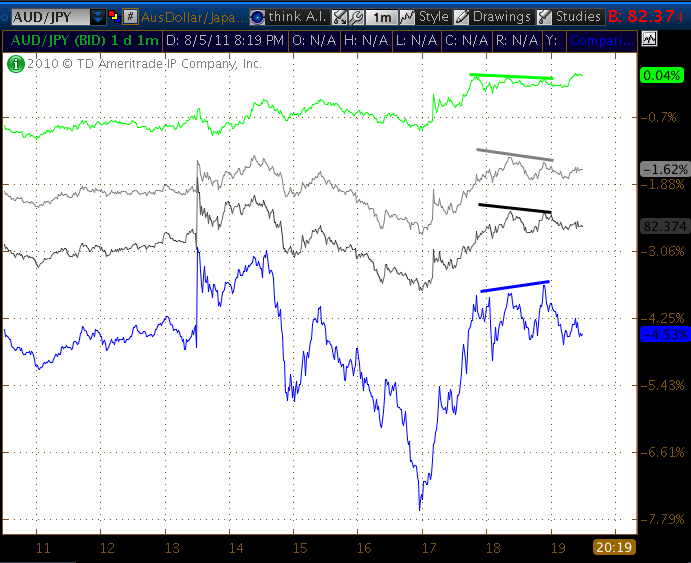
In additon to this there was clear divergence between the NASDAQ and key currencies;
E-Mini NASDAQ, AUD/JPY, EUR/USD, AUD/USD
Went short at 2213, the market sold off down to 2195.75, before rallying up taking out my trailing stop, filled at 2204.25 for an 8.75 point gain. The stop ought to have been trailed to 2203.75 but for some reason it wasn't, my platform was slow today, I guess the servers at ThinkorSwim must have been overloaded or something.
Entry and exit (Second red/green vertical lines)
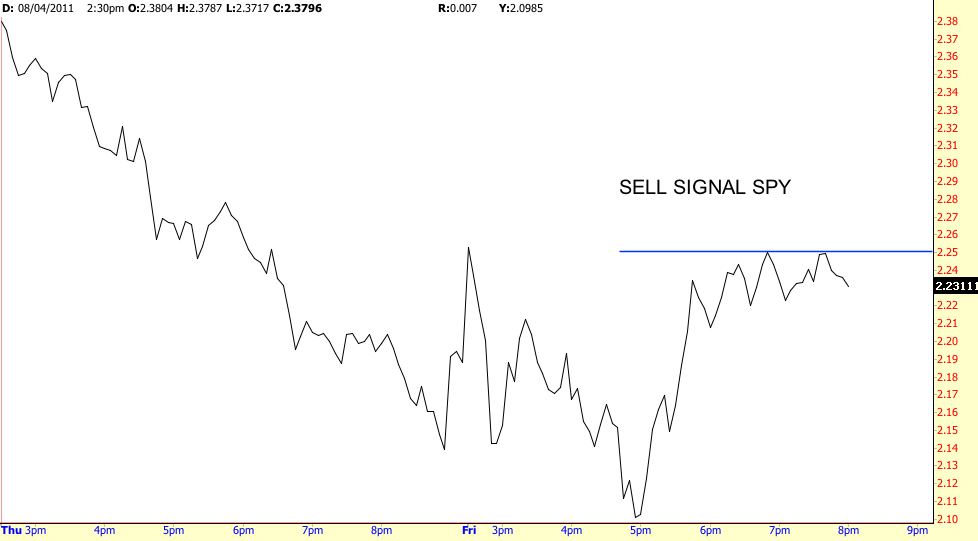
I then had a further sell signal on SPY at 19:50;
Went short at 2195.50, the market sold off to 2186.5 before rallying back up taking out my trailing stop, filled at 2193.25. For this trade I actually used a 5 point trailing stop, mainly since it was close to the close, clearly something was not quite right at ThinkorSwim HQ since my 5 point trailing stop (held on their servers) ought to have trailed the last price, therefore as the price had been to 2186.5, the trailed stop ought to have been at 2191.50, but was actually 2192.50 when the market order to exit was triggered, so I only got out at 2193.5 for a 2.25 point gain (due to slippage). I may look at changing my trailing stop loss orders since in volatile conditions the trail point is far too slow to update, it doesn't keep up with the market at all. It's a shame the CME doesn't allow trailed stops held exchange side.
Entry and exit (Third red/green vertical lines)
Of course in hindsight the very obvious trade was to short the rally up to the pre-market high created on the nonfarm payroll market reaction, I did consider it at the time however I use charts that update on a 1 minute timescale and the next print of price on my chart was 7 points away from the pre-market high so I thought it had moved too far to enter short, of course the market tanked 59 points following my decision not to short at that point. I have gradually been discovering tick charts.
What are tick charts? These are explained here. Tick charts are nothing to do with the $TICK indicator that tells you how many stocks are "ticking" up or down by the way. Tick charts give you a much better feel of what the market is doing. In fact at one point I felt like going short based on the charts, I didn't, but I should have as the market sold off 13 points thereafter. Of course I'm new to the discretionary trading game having only previously taken trades based on my indicators, but it's an interesting avenue to explore further.
The nonfarm payrolls number was released at 13:30 (BST), I was on the train on my way home from work, it came in at 117K, 26K higher than expected.
The NASDAQ futures moved in a 42.25 point range inside 1 minute, an excellent example of why trading in front of news is a bad idea. Anyone short into that would have got blown away almost instantly.
Today was a rollercoaster of a day for the markets, VIX spiked up to 39.25, last seen in 2008/09 during the credit crisis.
Anyone trading amid this volatility must be crazy.
I had three trades today;
The first was what I thought looked like an opportunity to get onboard a developing flash crash. The E-Mini NASDAQ had been as low as 2180 in pre-market trading. The nonfarm payrolls number catapulted the NASDAQ from 2197 to 2239.25 at 13:30, the market then sold off down to 2211 before rising back up to touch the 2239 level. There then followed a strong bout of selling that got progressively steeper and steeper and steeper, I didn't want to miss a ring-side seat to a flash crash so I went short at 2179.50, the market kept selling off down to 2172 and stopped dead, I moved my stop to 2177.25 so I would at least get something out of if, the market rallied sharply taking out my stop for a 2.25 point gain.
Entry and exit (First red/green vertical lines)
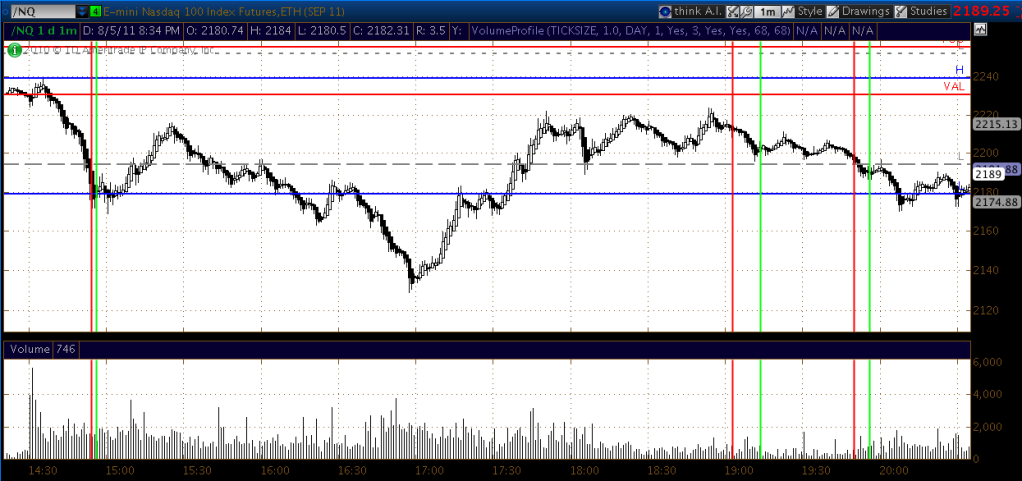
I then had a sell signal on E-Mini Dow Jones futures at 19:00;
There were also sell signals on SPY and DIA at the same time.
In additon to this there was clear divergence between the NASDAQ and key currencies;
E-Mini NASDAQ, AUD/JPY, EUR/USD, AUD/USD
Went short at 2213, the market sold off down to 2195.75, before rallying up taking out my trailing stop, filled at 2204.25 for an 8.75 point gain. The stop ought to have been trailed to 2203.75 but for some reason it wasn't, my platform was slow today, I guess the servers at ThinkorSwim must have been overloaded or something.
Entry and exit (Second red/green vertical lines)
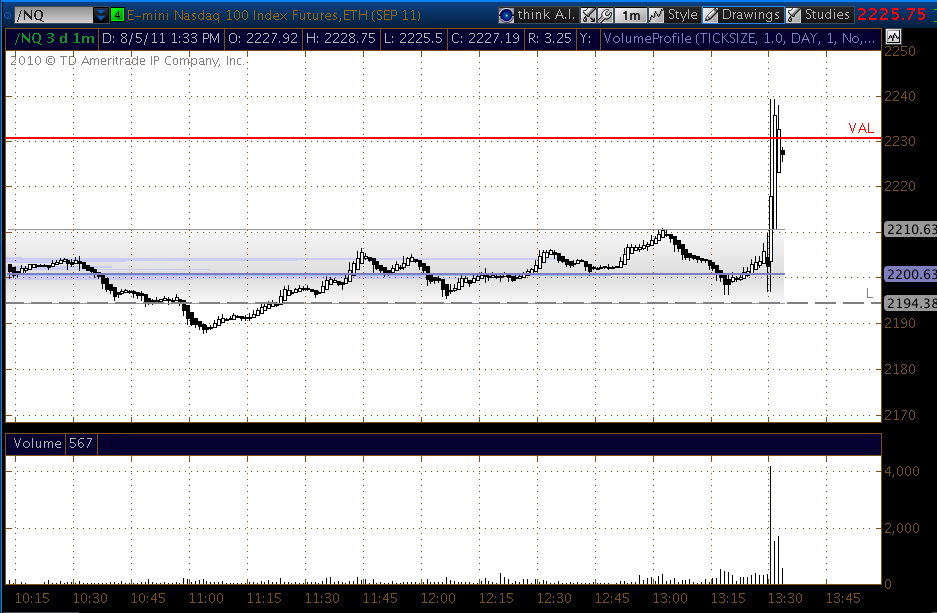
I then had a further sell signal on SPY at 19:50;
Went short at 2195.50, the market sold off to 2186.5 before rallying back up taking out my trailing stop, filled at 2193.25. For this trade I actually used a 5 point trailing stop, mainly since it was close to the close, clearly something was not quite right at ThinkorSwim HQ since my 5 point trailing stop (held on their servers) ought to have trailed the last price, therefore as the price had been to 2186.5, the trailed stop ought to have been at 2191.50, but was actually 2192.50 when the market order to exit was triggered, so I only got out at 2193.5 for a 2.25 point gain (due to slippage). I may look at changing my trailing stop loss orders since in volatile conditions the trail point is far too slow to update, it doesn't keep up with the market at all. It's a shame the CME doesn't allow trailed stops held exchange side.
Entry and exit (Third red/green vertical lines)
Of course in hindsight the very obvious trade was to short the rally up to the pre-market high created on the nonfarm payroll market reaction, I did consider it at the time however I use charts that update on a 1 minute timescale and the next print of price on my chart was 7 points away from the pre-market high so I thought it had moved too far to enter short, of course the market tanked 59 points following my decision not to short at that point. I have gradually been discovering tick charts.
What are tick charts? These are explained here. Tick charts are nothing to do with the $TICK indicator that tells you how many stocks are "ticking" up or down by the way. Tick charts give you a much better feel of what the market is doing. In fact at one point I felt like going short based on the charts, I didn't, but I should have as the market sold off 13 points thereafter. Of course I'm new to the discretionary trading game having only previously taken trades based on my indicators, but it's an interesting avenue to explore further.
Subscribe to:
Posts (Atom)