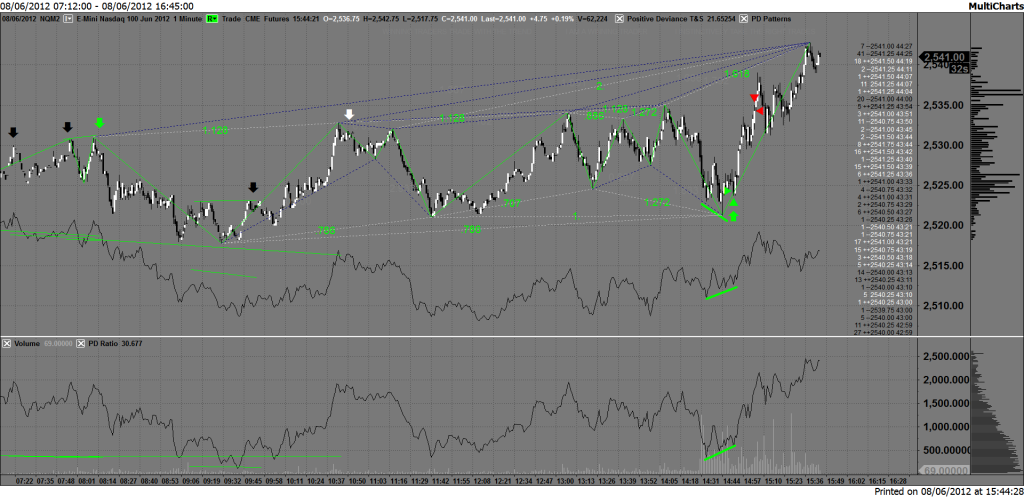
Interesting day today - not always for the right reasons!
Had an initial trade at 09:30 (that's 3:30 Chicago time), a short filled at 2557.50;
E-Mini NASDAQ futures;
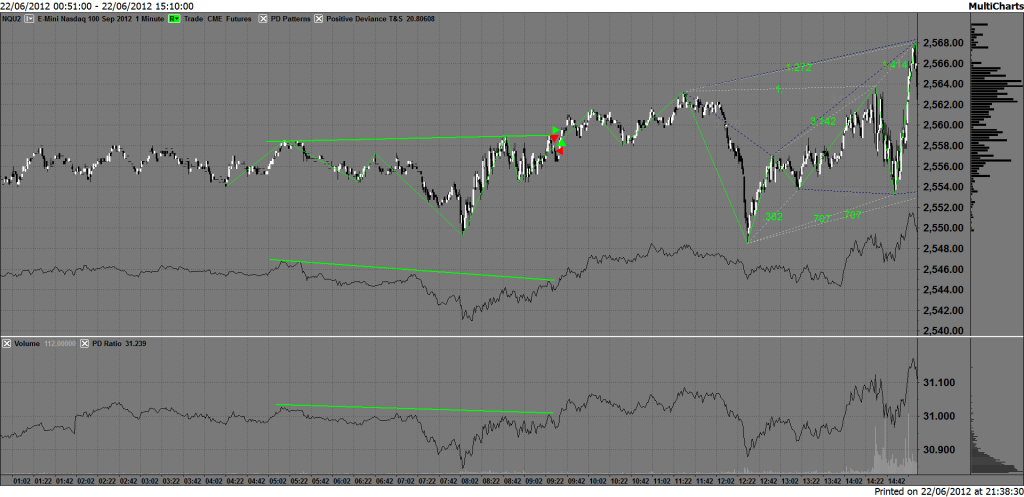
I was looking for a sell off, it never came, stopped out for a 2 point loss.
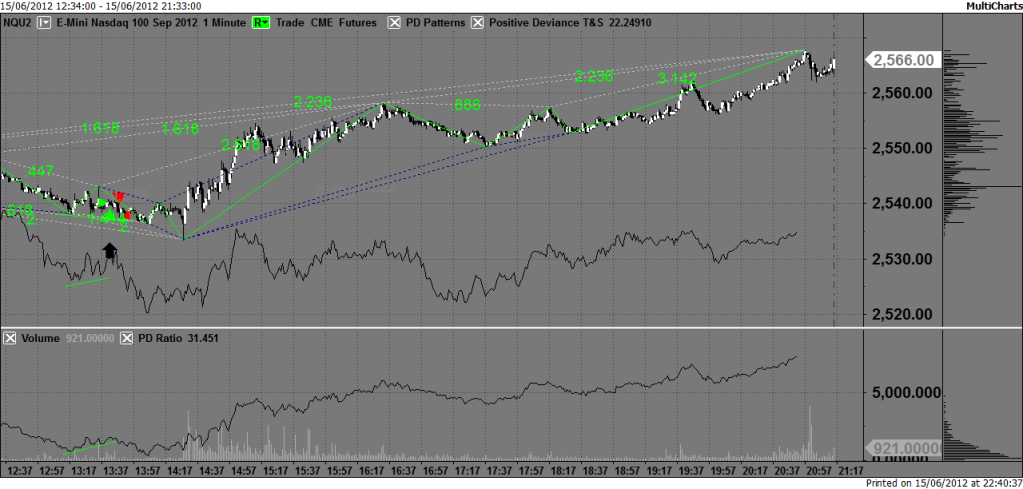
There
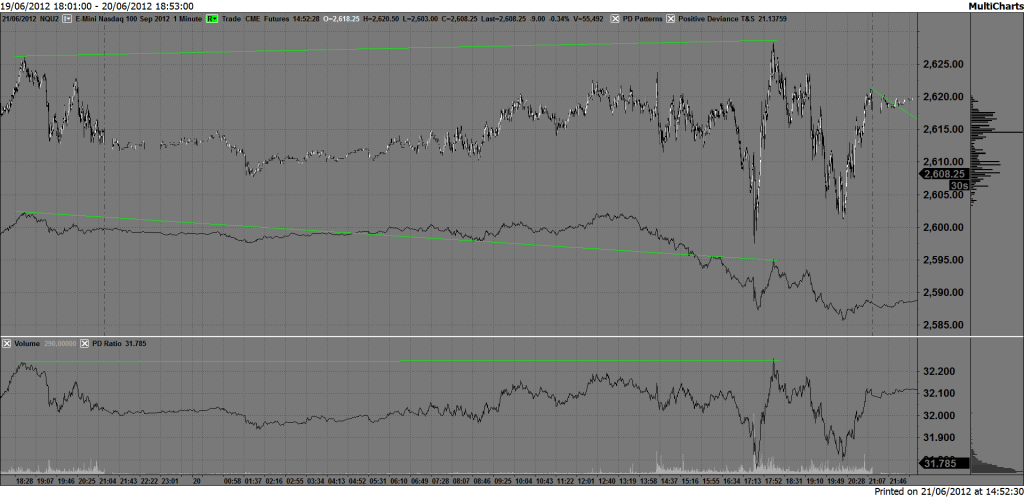
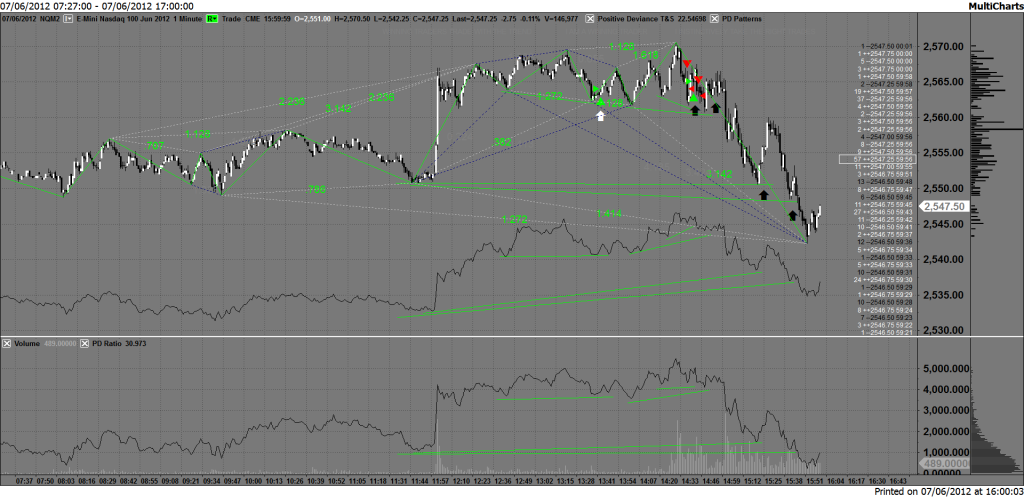
were 3 opportunities for trades today, that was one of them, the next
came at 12:35, I wasn't watching the market at this point, I checked
about 12:39 and spotted I'd just missed a buy signal. I was using my
mobile to monitor for signals (as I was away from my desktop) and it can
be quite challenging to monitor. A source of frustration since the
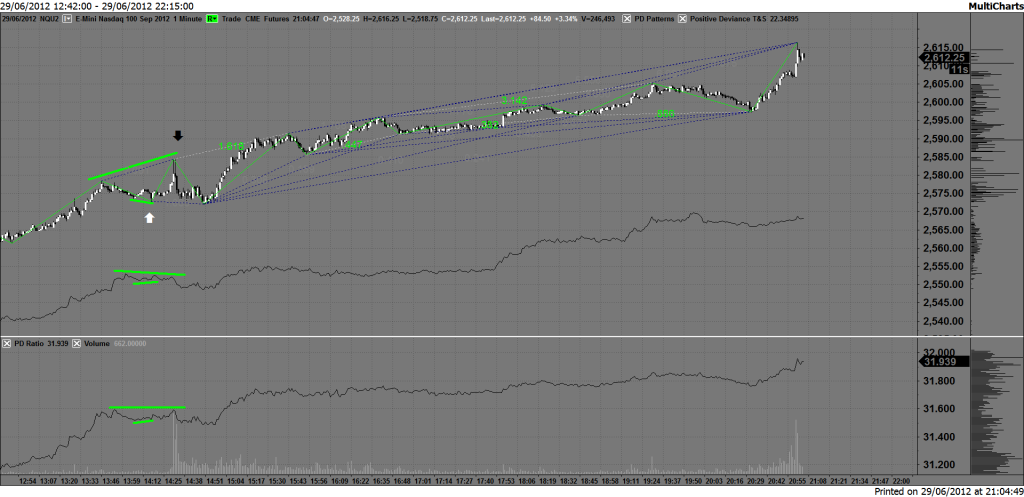
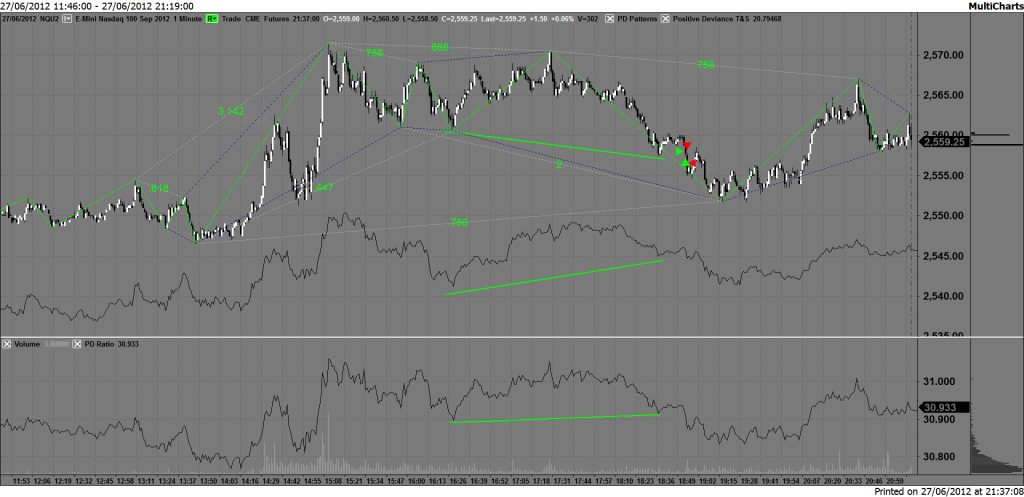
signal was spot on. I've highlighted the signal on the chart below,
using a green up arrow (just to left of centre of chart). A buy signal
for me is when the market diverges away from my indicators (the black
signal line beneath the chart, and the other separate one sectioned off
below). So you can see here the market made a lower low whilst my
indicators both made higher lows, that's my signal to go long. Anyway
I've made it a general rule these days not to discuss signals not traded
on my blog, but thought I'd highlight this one as a good illustration
showing what I'm looking for when I'm trading. It can be a source of
frustration to not be active watching the markets when a quality signal
is produced although it's tempered somewhat by the fact that I'd rather
not be surgically attached to the markets for the whole entire
day! From the point of the new low I wait 3 minutes for the market to
confirm it (by moving in concert with my indicators) then I trade it.
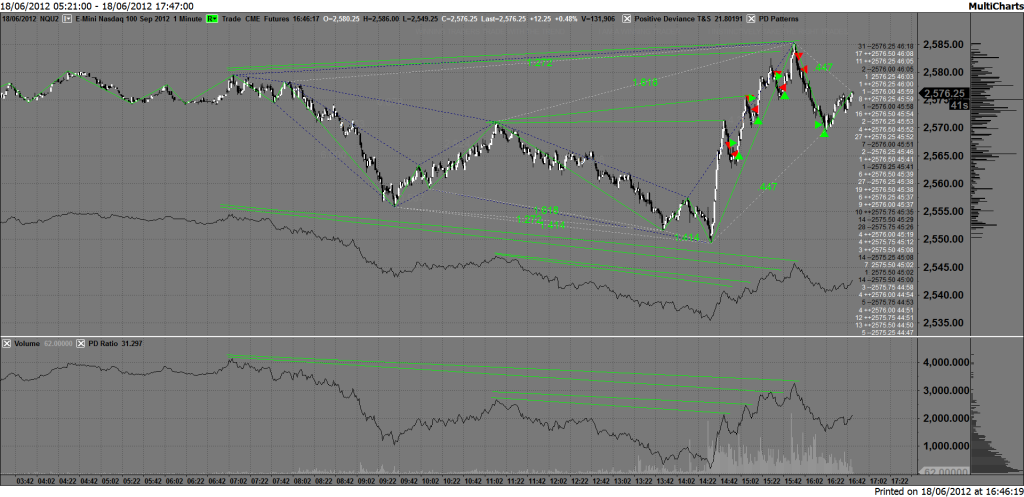
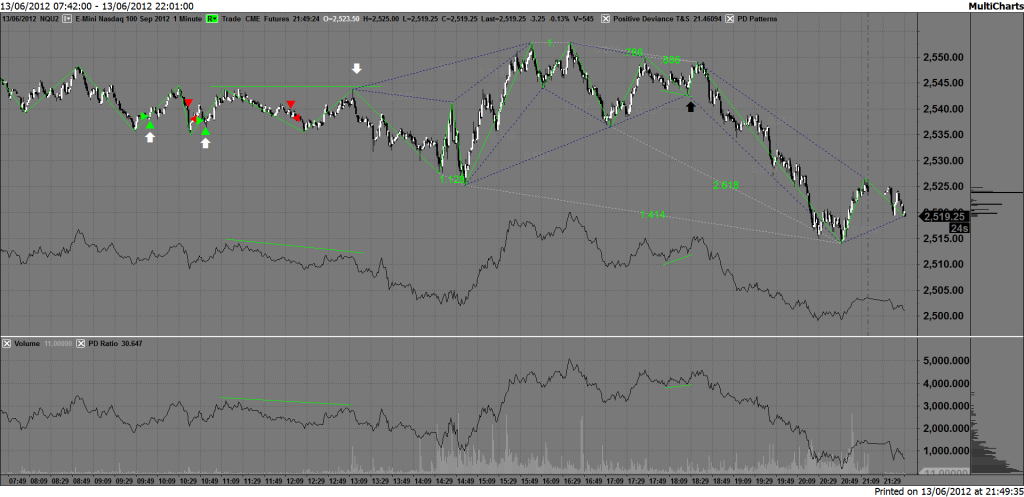
E-Mini NASDAQ futures;
The
other reason I mention this signal is because I've actually been
highlighting all signals that occur everyday on the NASDAQ and copying
the charts to
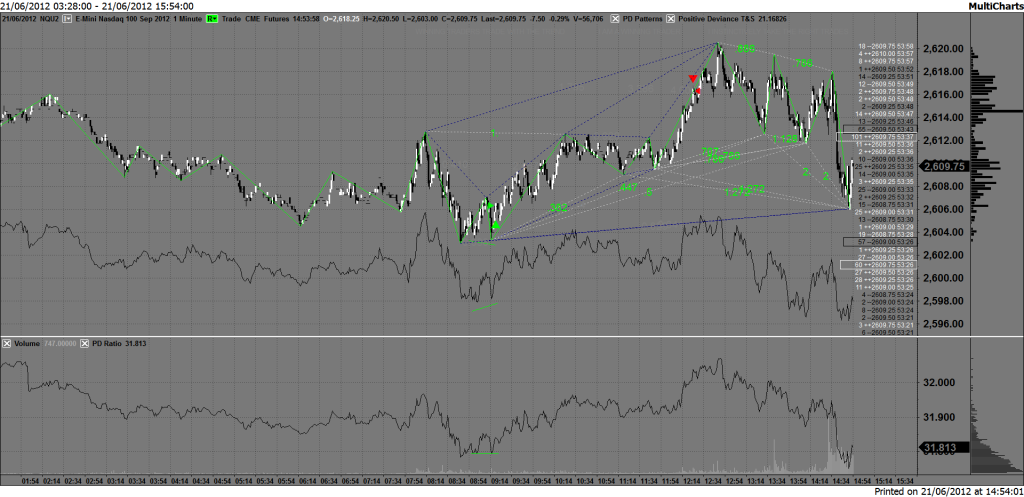
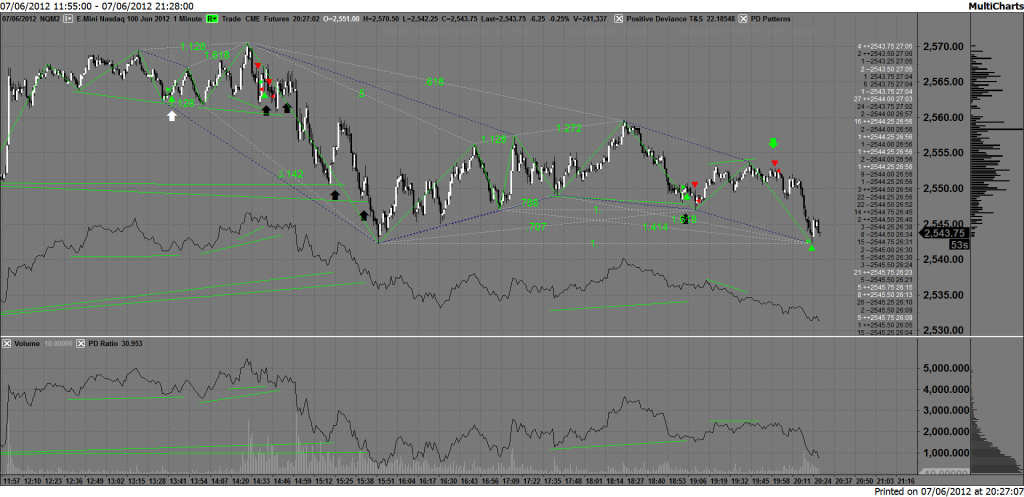
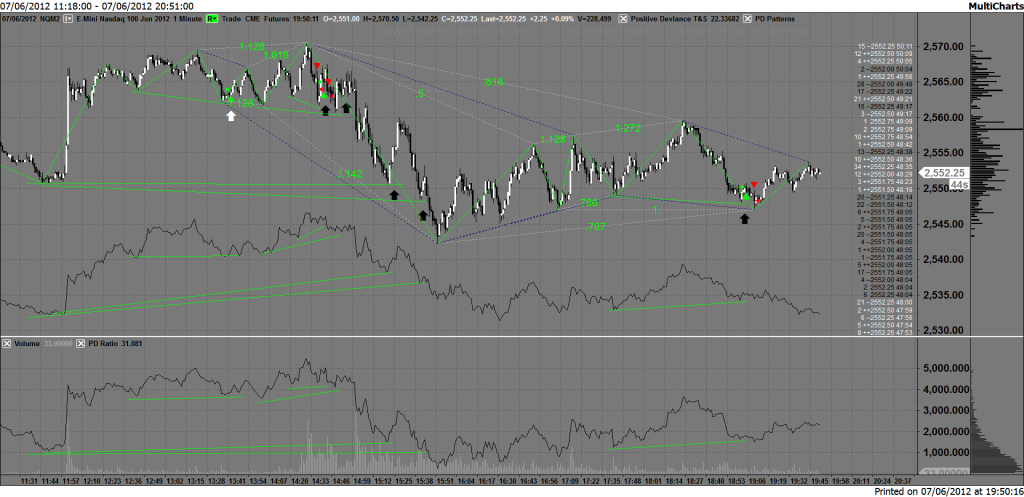
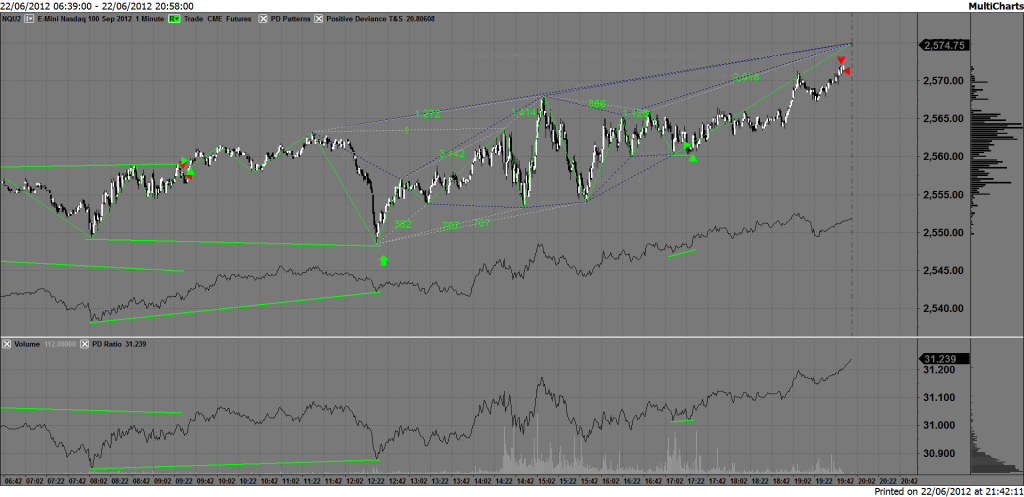
Pesavento Patterns on the NASDAQ 100 futuresGreen
arrows denote signals that lead to a 10 point move in the right
direction, black arrows denote failed signals that would result in a
stopped out trade and white denote signals that would result in a
breakeven. I'm also using Pesavento's patterns (Fibonacci retracements)
on those, so once there is enough data there I may be able to see some
patterns emerge either solely with the Pesavento Patterns or perhaps in
combination with the signals my own indicators generate.
(This is
distinct from the the green/red triangles that appear on the
charts. Green triangles pointing to a part of the chart means a long
orders filled, red triangles means short orders filled )
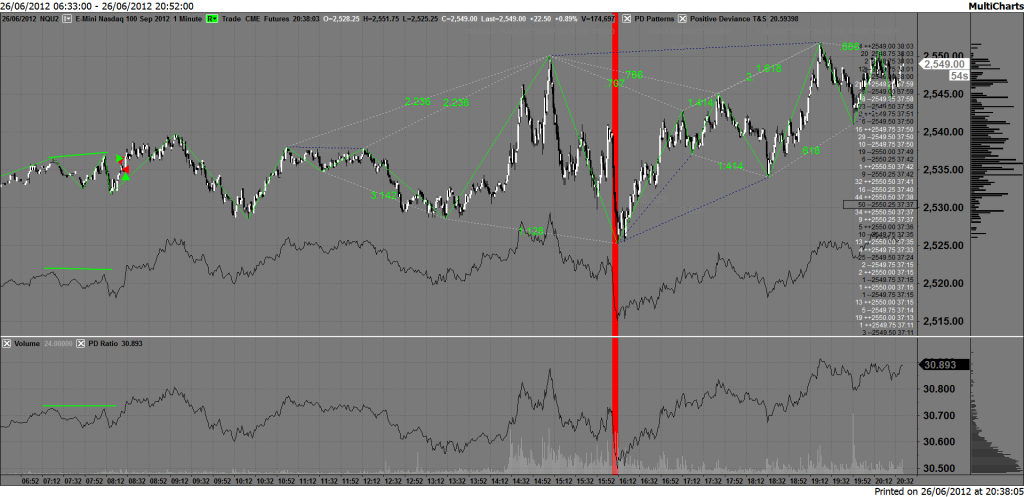
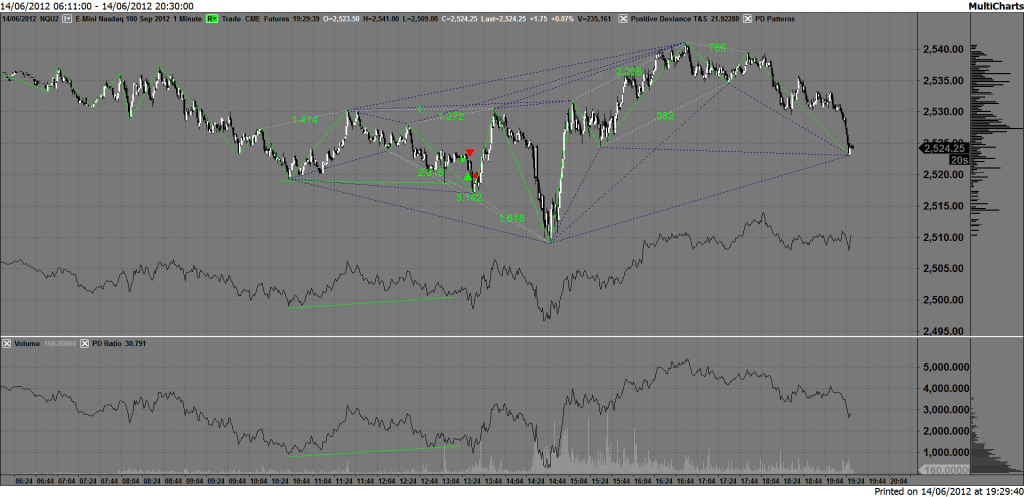
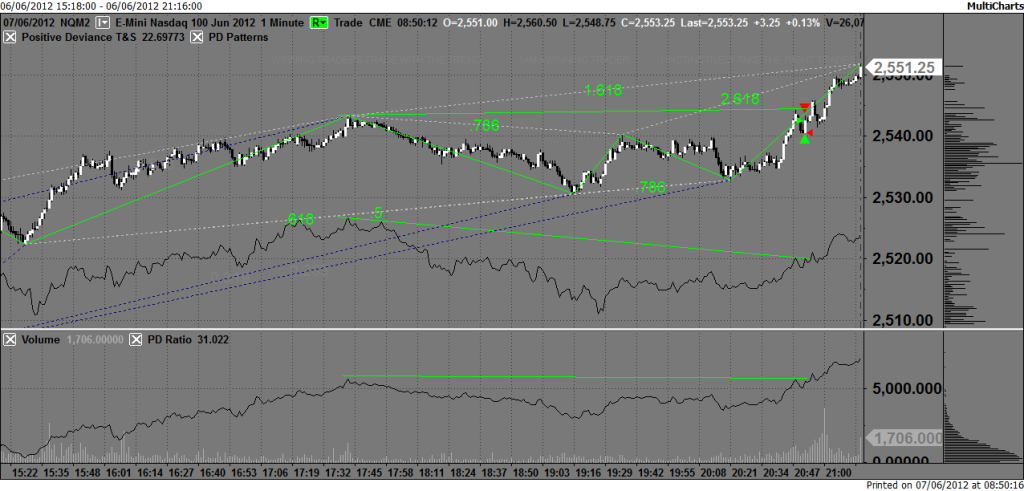
I had another signal at 17:28 to go long, filled at 2561.50 (latter part of chart);
E-Mini NASDAQ futures;
There
wasn't much on the data front today, after I went long the market
developed into a sideways chop, and moved 5 points in my favour so I
moved my stop to breakeven then my system crashed...
When I
restarted I saw that Multicharts seemed to have duplicated all of my
existing orders in the market, so I cancelled these "duplicate" orders
(or so I thought) however when the market traded above my exit point of
2671.50 the order didn't get filled.
I closed the trade out
manually for a gain of 10 points, however my system still showed active
orders in the market and I was unable to cancel them! Tried restarting
Multicharts and again same issue, existing orders in the market and I
wasn't able to cancel them....just prior to a weekend close.....****!
Well
that was the first time I've had to call the emergency trade desk in
Chicago for Mirus Futures (my broker) and they were excellent,
confirming that I was both flat and had no orders in the market
(contrary to what Multicharts was telling me).
My partner
explained that I'm probably pushing my computer too hard, what with all
the real time data I'm streaming from my broker, I often watch BBC / RT /
CNBC and also have the excellent Ransquawk service giving live market
news and commentary. This seems to be a bit too much for my little
machine it gets hot under the collar, the fan starts going and then
it...well crashes. Doesn't happen that often, just often enough for me
to now be considering buying a completely new machine just for trading,
much higher spec in terms of processor, memory, cores etc.
Not the most tranquil days trading...