Friday 29 November 2013

The position after this week's trade;
Wweekstrade_zps5f21b015.png

Trade stats for November;
Monthlyanalysis_zps9d0f41c4.png

Wednesday 27 November 2013

1 trade today
RT1_zpsbaf666ac.png

1 win

No trading tomorrow, it's thanksgiving, and unlikely to trade Friday given its likely to be quiet and futures markets close early.

Happy thanksgiving to my American friends!

Tuesday 26 November 2013

Friday 22 November 2013

The position after this week's trade;
PandL_zps00adfb78.png
2 trades today;
Tradestoday_zps7b75a0b1.png

1 win and 1 loss

22nd May 2103 NASDAQ 100 futures; (intermediate top)
Inter_zps326aec9f.png

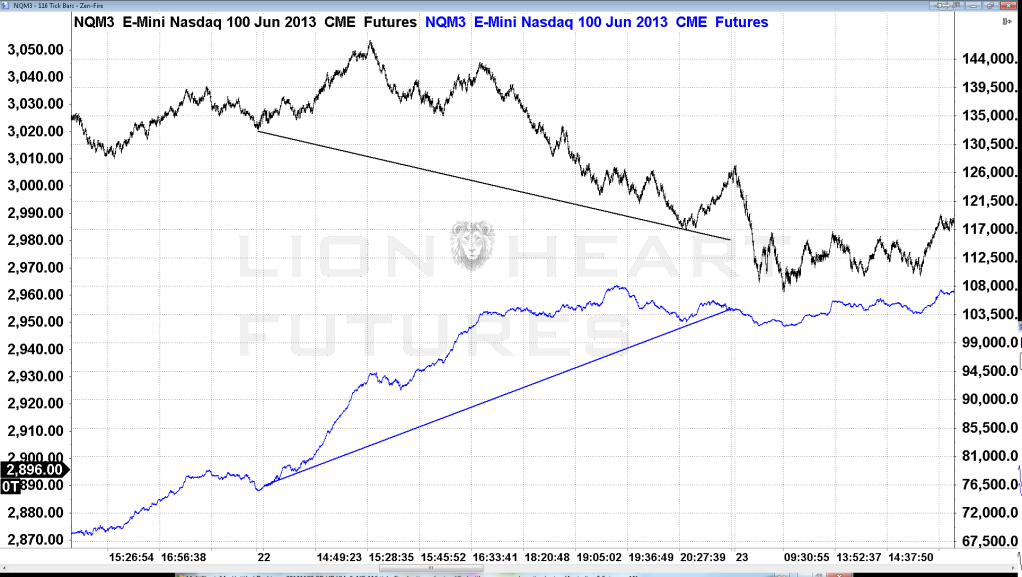
3rd May - 12th June 2013 (Intraday volume);
Inter2_zps685c46d7.png

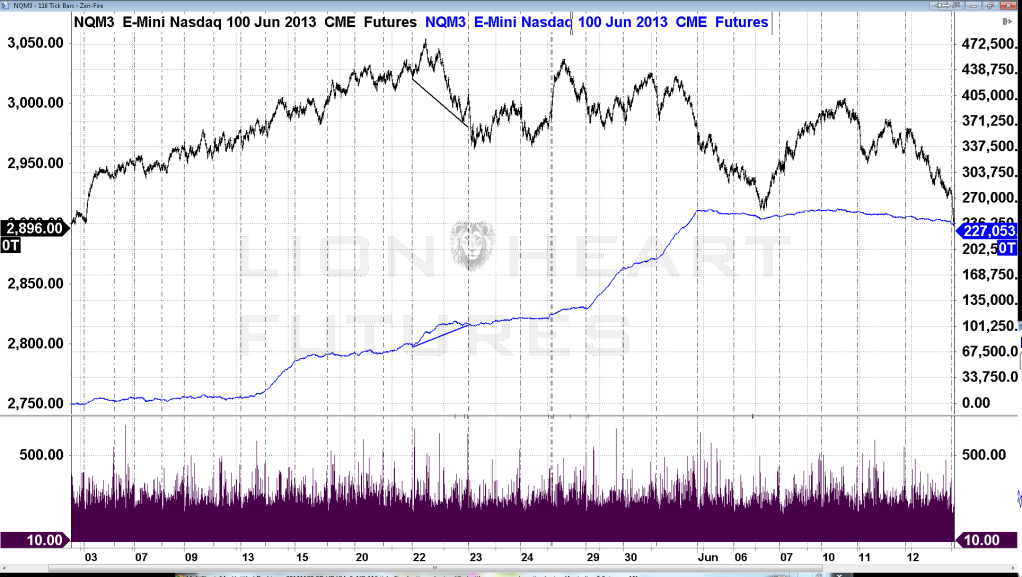
10th May 2013 - 8200>7500
13th May 2013 - 7500>18000
14th May 2013 - 18000>55000
15th May 2013 - 55000>65500
17th May 2013 - 65000>65000
20th May 2013 - 65000>67000
21st May 2013 - 67000>75000
22nd May 2013 - 75000>104000 ~ 29
23rd May 2013 - 104000>112000 ~ 8
24th May 2013 - 112000>115500 ~ 3.5
28th May 2013 - 115500>124000  ~8.5
29th May 2013 - 124000>180000 ~ 56
30th May 2013 - 180000>190000 ~10
31st May 2013 - 190000>253000 ~ 63
5th June 2013 - 253000>249000 ~ 4
6th June 2013 - 249000>246000 ~ 3
7th June 2013 - 246000>254000 ~ 8
10th June 2013 - 254000>251000 ~ 3
11th June 2013 - 251000>244000 ~ 7
12th June 2013 - 244000>235000 ~ 9

Thursday 21 November 2013

Wednesday 20 November 2013


Wedwater_zps64da4b8c.png

3 wins

Unusual day in terms of order flow, possibly similar situation to previous intermediate top in US equity markets but since I'm away from home I'm trading remotely so unable to do proper analysis until Friday when I'm back home.

Tuesday 19 November 2013

Sunday 17 November 2013

I've looked at nearly two months data for NASDAQ 100 futures over the weekend with a view to seeing if the current strategy I'm trading using Dow Jones futures would also work on that market.   It doesn't seem too encouraging so far, I think I'll need to make some adaptations to it, or perhaps I'll do some research on Russell 2000 futures instead, when I have more time.

Friday 15 November 2013

After this week's trade
LHFPampL1511132_zpsb188acdd.png

This week was bookended by losses on Monday and today

4 trades today;
Trade_zpsd933d8b9.png

1 win and 3 losses

When I looked back over the last three years of this trading journal I realised that there are really three distinct types of trading available to me based on my analysis work over the last 3 years;

1. Trading an edge on an intra-day basis.
2. Trading divergences between currency and equity index markets and divergences between individual equity index markets.
3. Special situations identified where a large opportunity develops in a specific market.


1. Refers to my day to day trading that I regularly write about on these pages.


2. Relates to scenarios such as the following;

Stock index future divergence from currency markets;
C1LHF_zpsa21d9009.png


and


Divergence between stock index futures
D1LHF2_zps6f804583.png


3. Relates to scenarios such as the following;

On 7th April 2012 I identified a bubble in the relative cost of energy per MMBtu when comparing Crude Oil to Natural Gas, the point where the trend in the ratio broke signalled the low in Natural Gas

The ratio in log of Crude Oil (cost per MMBtu) to Natural Gas (cost per MMBtu) shown in comparison to Natural Gas;
NAT2_zps173e6a2a.png

Thursday 14 November 2013

Wednesday 13 November 2013

Good results today;

Trades4_zps6b833745.png

4 wins, 2 losses and one closed early near breakeven.

As previously mentioned my historic ratio of wins to losses is typically 1 : 1, with some movement.  Days like yesterday and today push the ratio in the right direction.

I'm doing some research to see whether this same type strategy could be used trading NASDAQ 100 futures, I'm aiming to get most of it complete at the weekend, it's time consuming work to do it properly.

Yesterday's trades (4).

Trades2_zps7d495691.png

3 wins with 1 loss.  I'm sure it's self explanatory however a red arrow indicates a sell and a green arrow indicates a buy.  So the first arrow is red indicating an entry into a short trade, the next green arrow indicates the trade exit point.  The next green arrow following that is an entry into a long, that was the trade that got stopped out.

Friday 8 November 2013

18 trades this week

Performancetodate_zps8c046f09.png
P2_zpsa253f635.png

Looking at the overall position in terms of numbers of trades the win/loss ratio is a fairly consistent.  It fluctuates over time around the 1 : 1 mark, it's 0.95 : 1 right now.  Consistency is the most important factor since trading futures is a scalable business, if you have consistency then you can develop the size over time. The question is what condition you set for an increase, I think it has to be based on consistency, capital available and expected draw down periods.

The strategy that I'm using is one that I can only see being impacted if there were some sudden and dramatic changes in the make up of the participants in the futures markets and I can't see that happening unless there were some regulatory changes limiting market access.

Friday 1 November 2013

Interesting day today, in the Dow Jones Industrial Average the retail traders were bearish almost all day whereas the market itself actually closed higher although for the first half of regular trading hours it did paint a slightly bearish picture.

Today_zps54e6de25.png

A difficult market to navigate today and unusual too - 7 trades and I ended the day only up by a small margin.


I am now at the 3 month point with this strategy and here is where I stand.

Today2_zpsc712f25b.png
Today3_zpsa86032f2.png

This is the sort of performance I am looking for.  The Dow Jones Industrial Average has a low number of constituent components (30) with the main publically owned large cap businesses in the US.  I think that and the large cap nature of the index combine to provide less long term volatility and perhaps that explains why my strategy and trading matches well with that market.

I looked at the long term volatility of;

the Dow Jones Industrial Average using VXD
the S&P 500 using VIX
the NASDAQ 100 using VXN
the Russell 2000 index RVX

Over the last 8 years
Vol_zps9350cca6.png

The Dow Jones Industrial Average is typically less volatile than the S&P 500, at least using this measure.  I was surprised to see that the NASDAQ 100 volatility in grey has typically been lower than the S&P 500 and Dow Jones Industrial Average.  Most of the time the Russell 2000 has been the least volatile from this perspective.

I'll need to assess the possibility of using these same techniques on perhaps the NASDAQ 100 futures and/or the Russell 2000 futures.  The S&P 500 is one to avoid, it seems overladen with ultracompetitives colliding with each other.


Volumes of the different futures markets;

ES_zps4d68d8dd.png

NQ_zps7f4e1bb4.png

Ym_zps1fb9b77e.png

Russell_zpseb8f4c8c.png

There ought to be better opportunities in lower volume markets - less competition - and on that basis the Russell 2000 is more attractive than the NASDAQ 100.