Monday 31 October 2011

Gold miners

Google trends can often come up with some interesting data;

"GDX" searches on Google


Over the last 3 years there has been a very steady increase in news reference volume for GDX


Also "Gold miners" searches on Google;


A similar picture with gold miners.

More news reference volume clearly leads to more public awareness.  In some ways I think the performance of the miners compared to gold itself is perhaps related to the public still not believing in gold as it rises higher and higher, really typical of bull markets.   The majority aren't on board.   Perhaps a trigger point is needed, that may be a sustained rise above $2000.
Posted Image
Ray Dalio - New Yorker article about him here


This is based on Ray Dalio's principles. These are found on his Bridgewater Associates website.

What I've written about here are some elements of his principles document and since it is quite lengthy I've only chosen what I find to be the most meaningful parts of that, so it's not likely to be an accurate reflection of it, only my interpretation of the important points.


Who is Ray Dalio and what are his principles?

From Wikipedia;

"Ray Dalio (born in 1949 in Jackson Heights, Queens, New York, United States[1]) is an American businessman and founder of Bridgewater Associates.
The son of a jazz musician, Dalio began investing at age 12 when he bought shares of Northeast Airlines for $300 and tripled his money when the airlines went through a merger.[2]

Dalio received a BA from Long Island University and an MBA from Harvard Business School.

After completing his education, Dalio worked on the floor of the New York Stock Exchange and began investing in commodity futures.[2] He was a Director of Commodities at Dominick & Dominick LLC [3] In 1974, he spent a year trading futures as a Shearson Hayden Stone broker. [2] In 1975, he founded the investment management firm, Bridgewater Associates, and his investment advisory service began to attract pension funds worth millions of dollars. [2]

Dalio is a practitioner of the Transcendental Meditation technique and resides with his wife in Greenwich, CT.[4][5][2]According to The New Yorker he is the 55th richest businessman in the world, with a net worth of US$6 billion as of 2011.[6]
"


His most fundamental principle;

"Truth —more precisely, an accurate understanding of reality— is the essential foundation for producing good outcomes."


and others;

"I believe that evolution, which is the natural movement toward better adaptation, is the greatest single force in the universe, and that it is good."

"I believe that the desire to evolve, i.e., to get better, is probably humanity's most pervasive driving force."


For me, this one is the most interesting;


"I believe that the biggest problem that humanity faces is an ego sensitivity to finding out whether one is right or wrong and identifying what one's strengths and weaknesses are."

More here;

"Most of us are born with attributes that both help us and hurt us, depending on their applications, and the more extreme the attribute, the more extreme the potential good and bad outcomes these attributes are likely to produce. For example, highly creative, goal-­oriented people who are good at imagining the big picture often can easily get tripped up on the details of daily life, while highly pragmatic, task-­oriented people who are great with the details might not be creative. That is because the ways their minds work make it difficult for them to see both ways of thinking. In nature everything was made for a purpose, and so too were these different ways of thinking. They just have different purposes. It is extremely important to one's happiness and success to know oneself—most importantly to understand one's own values and abilities—and then to find the right fits. We all have things that we value that we want and we all have strengths and weaknesses that affect our paths for getting them. The most important quality that differentiates successful people from unsuccessful people is our capacity to learn and adapt to these things.

Unlike any other species, man is capable of reflecting on himself and the things around him to learn and adapt in order to improve. He has this capability because, in the evolution of species man's brain developed a part that no other species has—the prefrontal cortex. It is the part of the human brain that gives us the ability to reflect and conduct other cognitive thinking.
Because of this, people who can objectively reflect on themselves and others —most importantly on their weaknesses are—can figure out how to get around these weaknesses, can evolve fastest and come closer to realizing their potentials than those who can't. However, typically defensive, emotional reactions—i.e., ego barriers—stand in the way of this progress. These reactions take place in the part of the brain called the amygdala. As a result of them, most people don't like reflecting on their weaknesses even though recognizing them is an essential step toward preventing them from causing them problems. Most people especially dislike others exploring their weaknesses because it makes them feel attacked, which produces fight or flight reactions;; however, having others help one find one's weaknesses is essential because it's very difficult to identify one's own. Most people don't like helping others explore their weaknesses, even though they are willing to talk about them behind their backs. For these reasons most people don't do a good job of understanding themselves and adapting in order to get what they want most out of life. In my opinion, that is the biggest single problem of mankind because it, more than anything else, impedes people's abilities to address all other problems and it is probably the greatest source of pain for most people. Some people get over the ego barrier and others don't. Which path they choose, more than anything else, determines how good their outcomes are. Aristotle defined tragedy as a bad outcome for a person because of a fatal flaw that he can't get around. So it is tragic when people let ego barriers lead them to experience bad outcomes. "


So an important part in personal evolution is the realisation that our ego can often get in front of an objective conclusion. Our ego is a barrier towards finding the truth.


"Be radically transparent. Provide people with as much exposure as possible to what's going
on around them. Allowing people direct access lets them form their own views and greatly enhances accuracy and the pursuit of truth. Winston Churchill said, "There is no worse course in leadership than to hold out false hopes soon to be swept away." The candid question-­and-­answer process allows people to probe your thinking. You can then modify your thinking to get at the best possible answer, reinforcing your confidence that you're on the best possible path. "


This is about more in depth questioning taking place where the underlying factors and beliefs that lead to one's viewpoint or conclusion are looked at in more detail. Are they true?

Ray on weaknesses
;

"I met a number of great people and learned that none of them were born great—they all made lots of mistakes and had lots weaknesses—and that great people become great by looking at their mistakes and weaknesses and figuring out how to get around them. So I learned that the people who make the most of the process of encountering reality, especially the painful obstacles, learn the most and get what they want faster than people who do not. I learned that they are the great ones—the ones I wanted to have around me.
In short, I learned that being totally truthful, especially about mistakes and weaknesses, led to a rapid rate of improvement and movement toward what I wanted. "

Wednesday 26 October 2011

It's late now but tomorrow I'll write about Ray Dalio, Bubb posted some material about him on the main board.  I'd kept a link about Ray and his approach from last week, I'll need to look that up again.  Ray strikes me as a very interesting guy with a very interesting approach.

Meantime, here's a link to a New Yorker article about him.

Jeff Quinto skype


Skype meeting with Jeff Quinto:

Well, Jeff's a really affable character, it was an interesting hour   talking trading with him.  Even though my futures trading has only   produced small profits he thought I was doing well since I'm new to   trading futures and the markets have been, and are in, a difficult phase   to trade well. 

He explained that trading is really business of ensuring the balance is   right between winning and losing trades and making sure that the gains   clearly outweigh the losses.  The focus is not, and should not, be on   increasing the accuracy of winners (high win rate) but ensuring that the   strategy maximises the profits from the winning trades and minimises   losses from losing trades.  We talked about how my signals are typically   50% winners, 50% losers and that I need to create more of an advantage   by getting rid of trades that aren't working more quickly, by reducing   my initial stop size.  He advised that a trade should work  "immediately  and profoundly" otherwise it's a waste of time to wait  around while the  market does nothing, and in that time, another  opportunity could be  missed.  We talked about some of the statistics of  my performance.  One I  mentioned was that I kept records of the amount  of points the market  went against winning trades before they went the  my way, and that the  average stop required for the winning trades was  1.29 Nasdaq points. I  had reduced my stop from 4 points to 3.25 and  will now look at reducing  this down to 2.5 or 2.

In discussing my trailing stop he advised that it makes sense to take   this approach since you shouldn't restrict the amount the market is   willing to pay you.  You want to be available for those times the market   is willing to reward you and by using a runner you can do that.    However what he did say was that I should add more value to my trading   by moving my trailing stop manually, rather than let a platform do it,   and it's size should be adjusted to account for current market   conditions / volatility.  Trailing stops need to be dynamic depending on   the type of market conditions present, it's not a one size fits all   scenario.  I'll need to do some research on that aspect of my strategy.

My strategy is in some ways at odds to his Theory of Trading (being that   positions should only be taken in the direction of the inertia), since  I  am counter trend trading, and really do not consider the current  bias  of the market in my trading decisions, I just take all the buy or  sell  signals, so I could look at - only taking set-ups that are in line  with  some form of defined trend (?).   His theory is to enter in the   direction of the trend on retracements.   What I could do is incorporate   that in my strategy by adding a position to a winning position, on   retracements.   That would dovetail with his advice that you should   press your advantage.

We also spoke of indicators and he agreed with me that too many people   focus on that aspect of trading rather than the more important aspects   such as setting and sticking to a strict rules based method of trading.

Overall it was a useful hour, I liked his approach which is very much   encouragement to look at certain areas and think about what fits into   your own trading style, whilst keeping in mind the basic principles of   profitable trading.  Once I've slept on it I may have more to add.

In finishing he advised he was looking forward to getting an email from  me in the future, telling him about my successful trading.

I'm looking forward to that too.

Monday 24 October 2011

I've been spending some time on Multicharts trying to find or create an indicator that I can layer on top of my DBDT indicator that will automatically highlight double tops and double bottoms.  The one on the following chart of my indicator working on E-Mini NASDAQ futures is one I drew in manually.  The ideal scenario would be to automate that part of the process;


It's not as simple as it sounds however, I found an indicator that can highlight these points but it can only do so on a chart of data for an underlying (eg S&P500 or NASDAQ futures) not an indicator plot such as mine above.  If I were able to do this it would be the first step to be able to systematically analyse trade set-ups using my indicator, rather than doing it manually.  If I could do that I'm sure it could provide some interesting insights into where I should be directing my energy however it's beyond my ability to do at the moment since I'm not conversant with Easy Language  (the programming language you can use to create indicators/strategies on Multicharts).


My indicator in black with the E-Mini NASDAQ in grey

"The Money Shot"


Back on 5th October I posted a buy signal I had on GDX, I ended up buying gold that day, and more some days later.  Well yesterday I re-bought the positions I had to sell in GDX and GDXJ before ThinkorSwim closed my account with them.

The buy signal I had on GDX on 5th October was also matched by a buy signal on GDXJ, although I didn't check that at the time.

DBDT indicator working on GDXJ;


So on the 5th October a double bottom formed on my indicator working on GDXJ, a huge one with no lower points on the chart.  It will be interesting to see in the future if this turns out to be a significant low in the Gold complex.

I also bought some UXG (United States Gold), there was also a buy signal on that back on 5th October;

DBDT indicator working on UXG;


Here's the same two points on a standard chart of UXG;


I plan to keep these positions for a very long time.

Friday 21 October 2011

Where I'm at

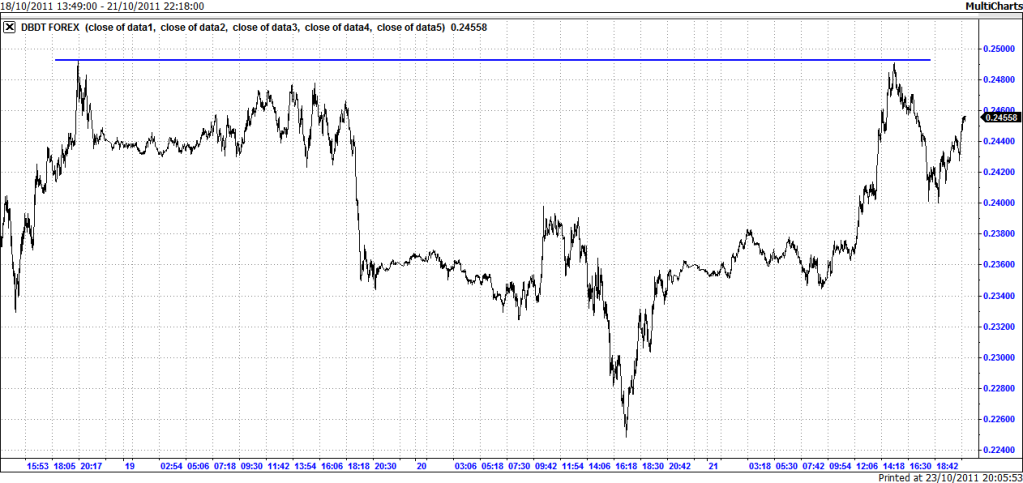
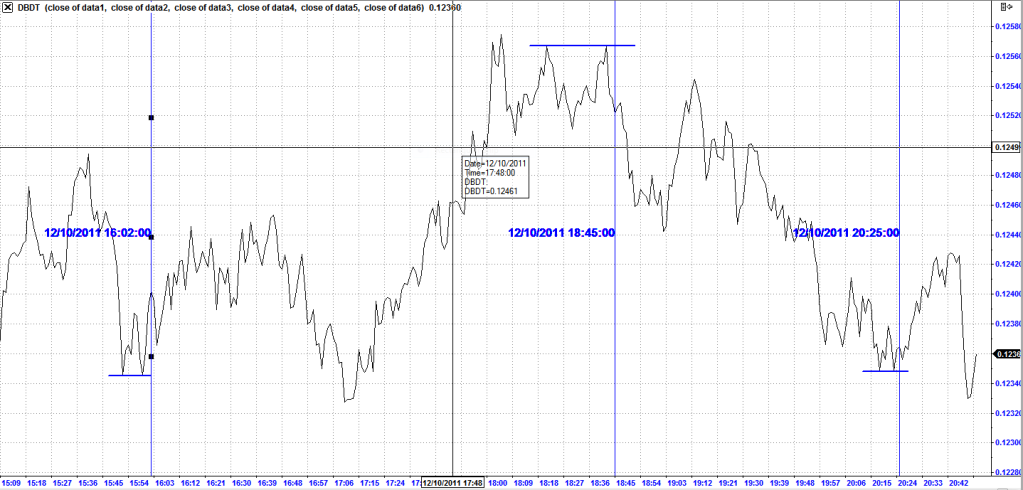
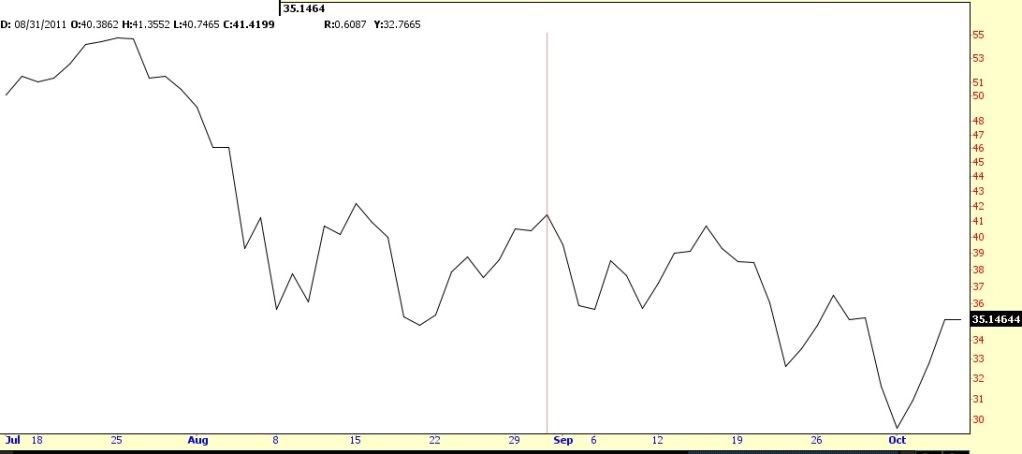
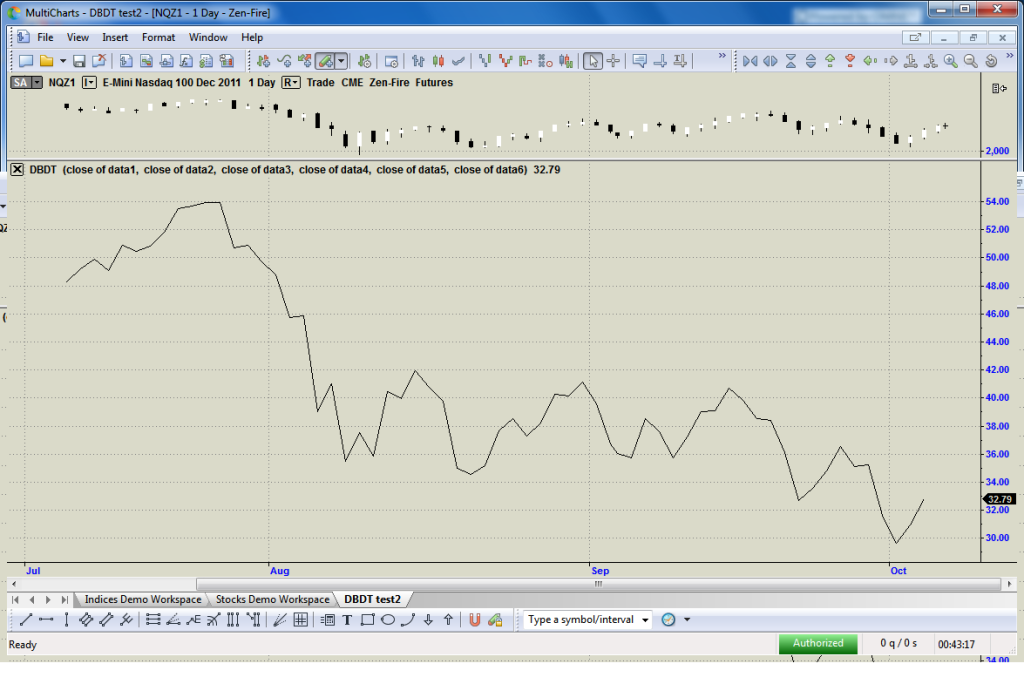
This is a currency divergence chart showing E-Mini NASDAQ, AUD/JPY, AUD/USD, EUR/USD taken before the close on October 17th;


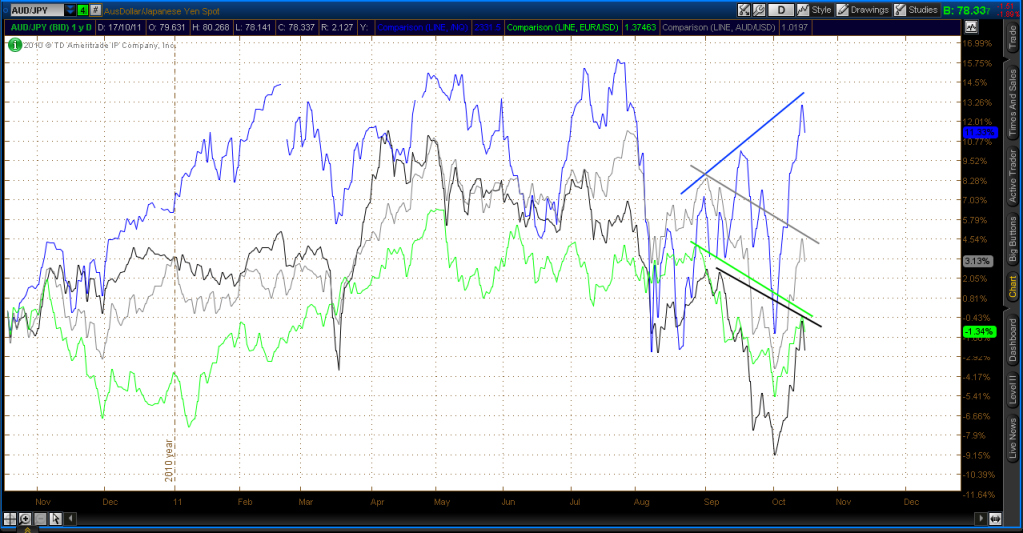
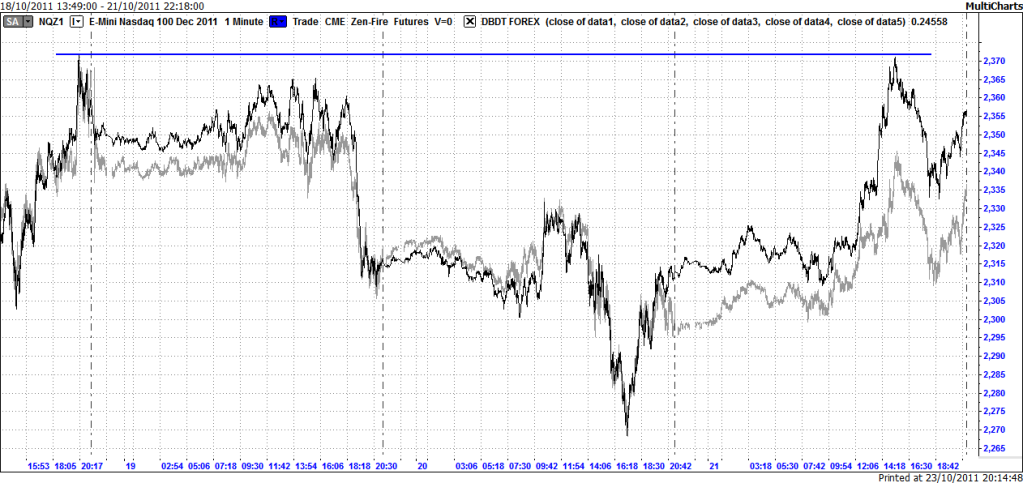
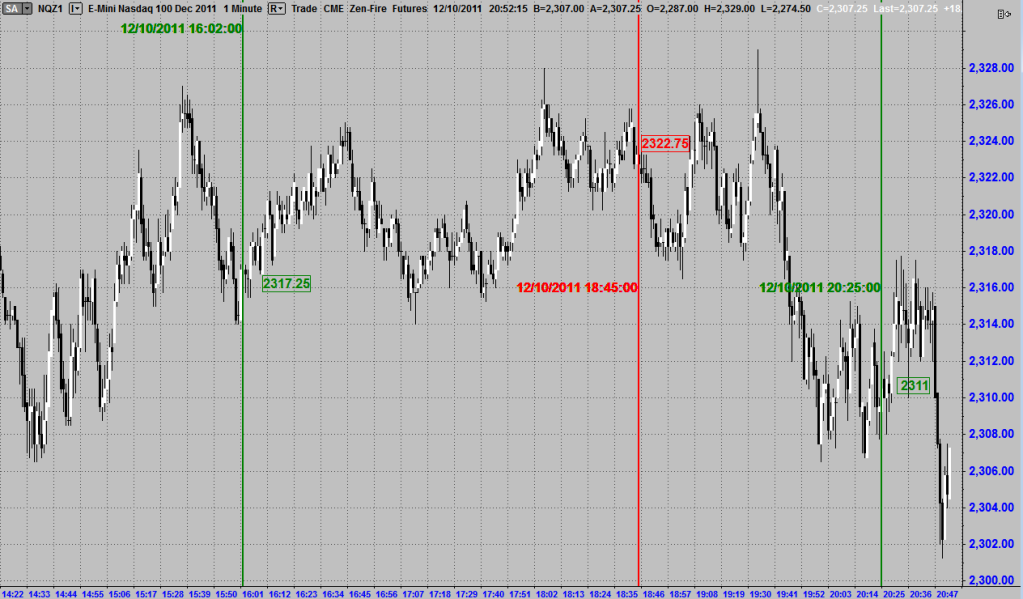
It betrayed further downside, and that's exactly what happened.

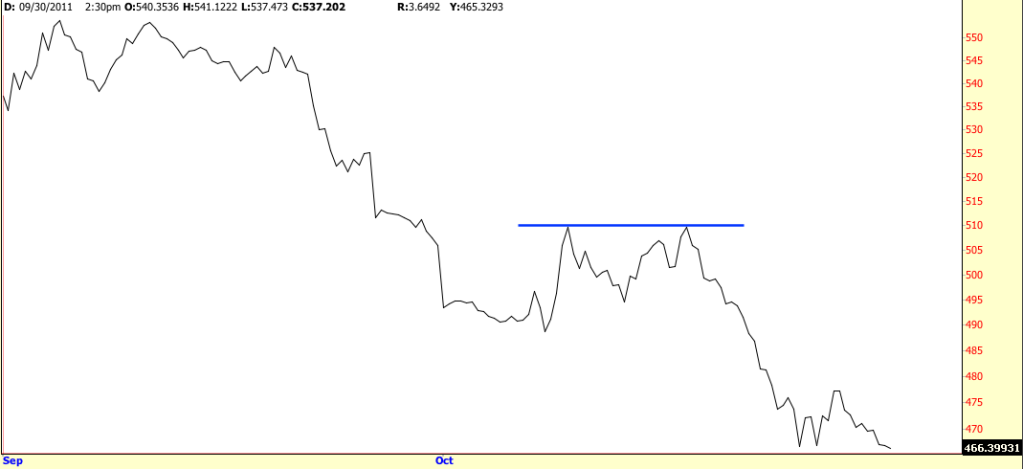
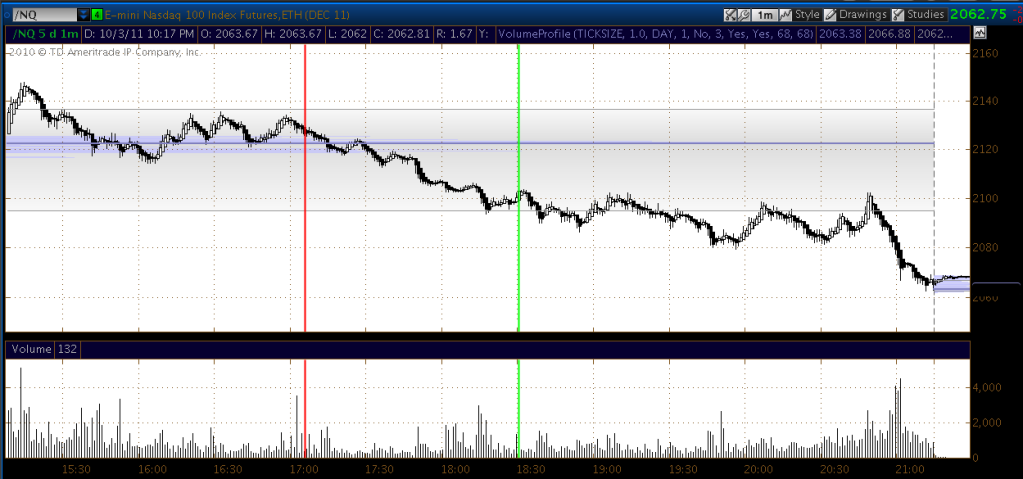
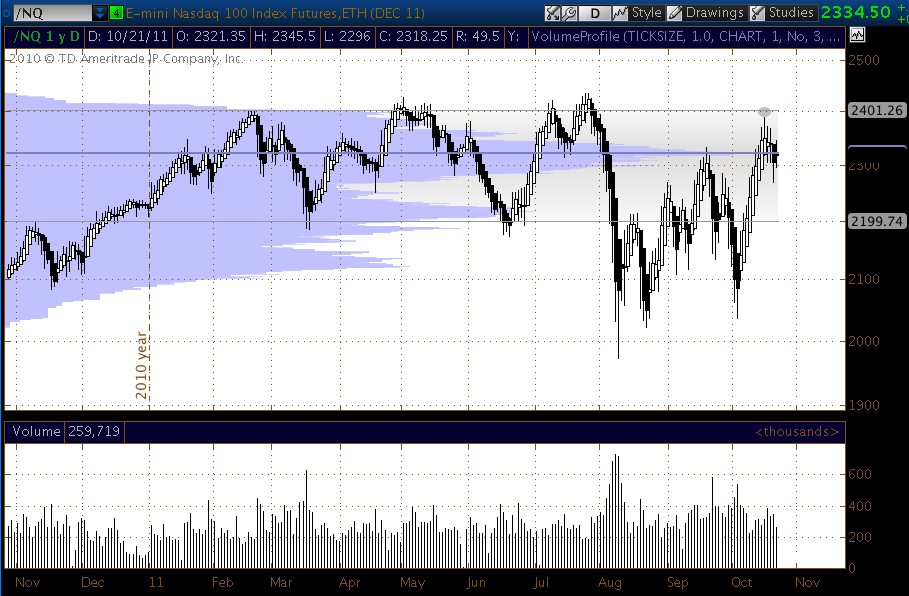
E-Mini NASDAQ with October 17th marked;


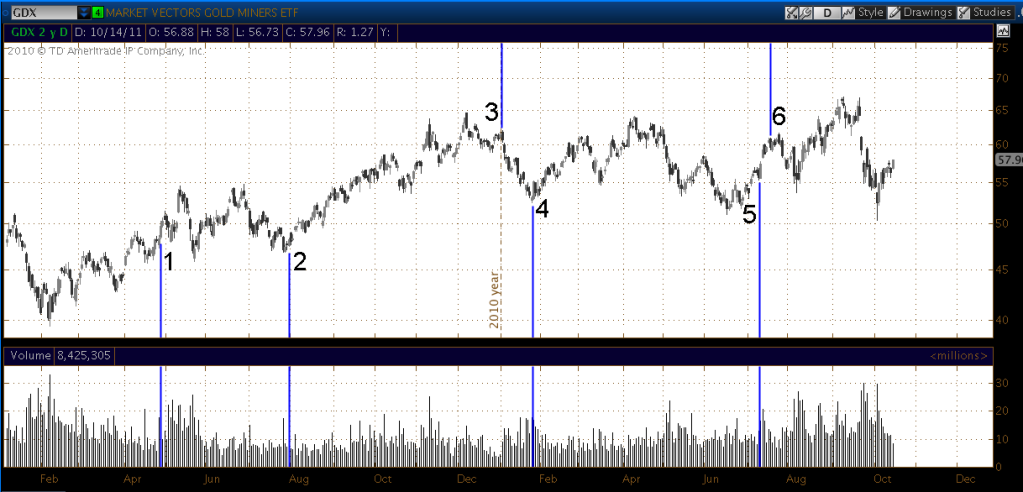
I've been looking back to my trading results from March 1st until August 8th when I had to stop as ThinkorSwim ceased operations in the UK.


Some charts follow showing different aspects of my trading, and the system I use;


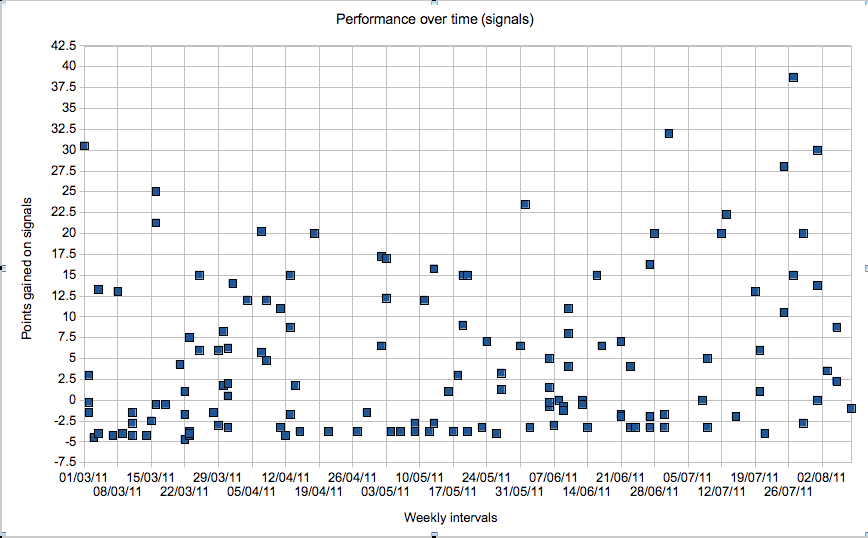
This shows the the potential amount of points available to gain/lose for each signal on my system from 1st March to August 8th. An even spread with an upswing towards the end, potentially as a result of switching my indicator to futures based data.


This next one shows, from those signals generated, the actual trades I took;


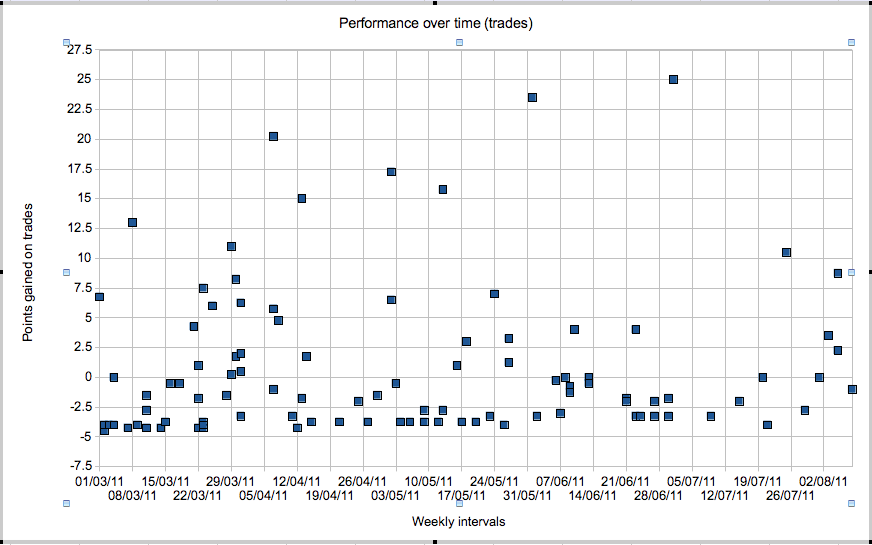
I missed some of the good ones during times when I was unavailable to trade, and sometimes as a result of taking breaks from the screen.


This next one shows all of the actual signals generated, but in the context of the time in the trading day when they were generated, and the potential gain available per signal;


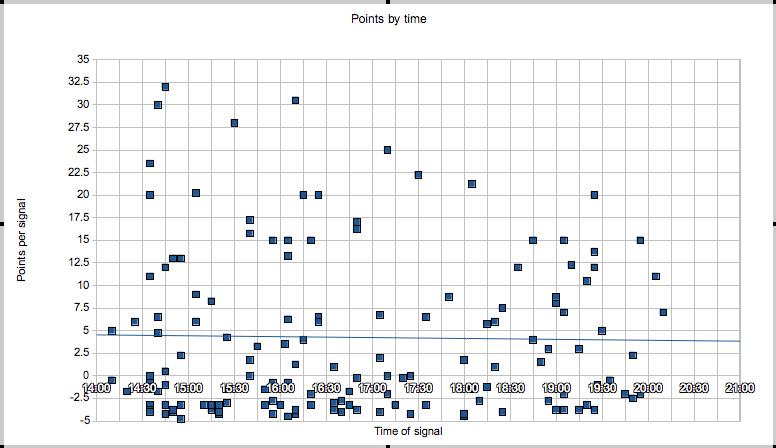
Clearly the best times to trade are the first two hours of the trading session and the meat of the afternoon session, prior to the close. Fewer signals during the quieter lunchtime period.

Although signals generated in the first two hours of trade generally led to potentially higher gains than the later session, signals were more likely to be stopped out, so signals in the latter half of the trading day had a higher probability of success and a lower probability of a large gain.

Next is the actual trades taken by time of day initiated and points gained;


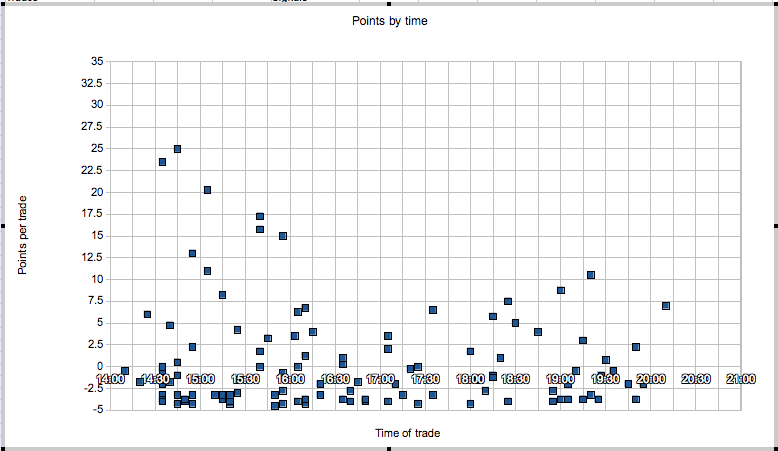
There is a cluster of trades stopped out in the first hour. Trades initiated after the first hour were, relatively speaking, more likely to succeed.


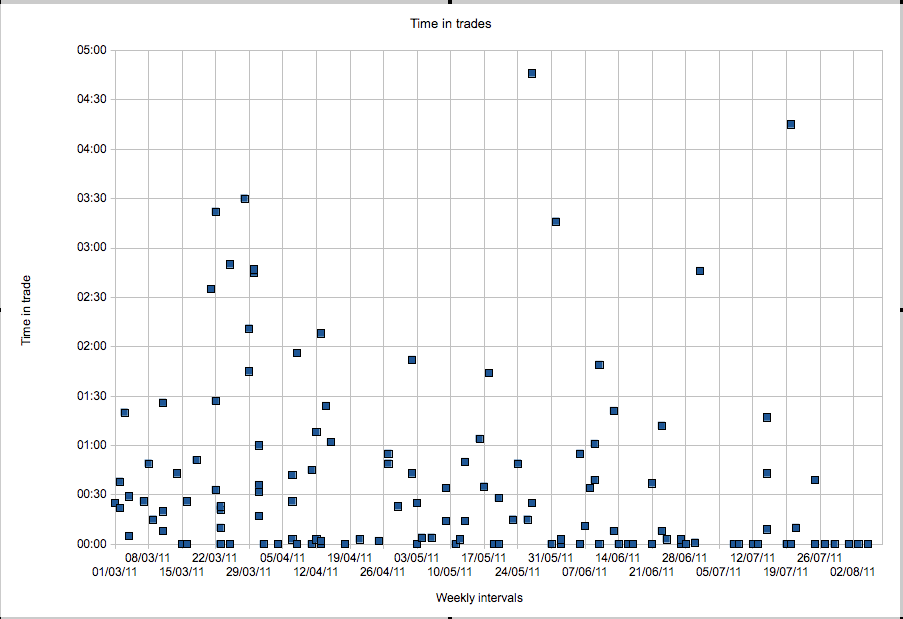
This next one shows length of time in trades, put together as a result of a suggestion from a Jeff Quinto video. The longest was 4 hours 48 minutes;


Next is time in trades by points gained;


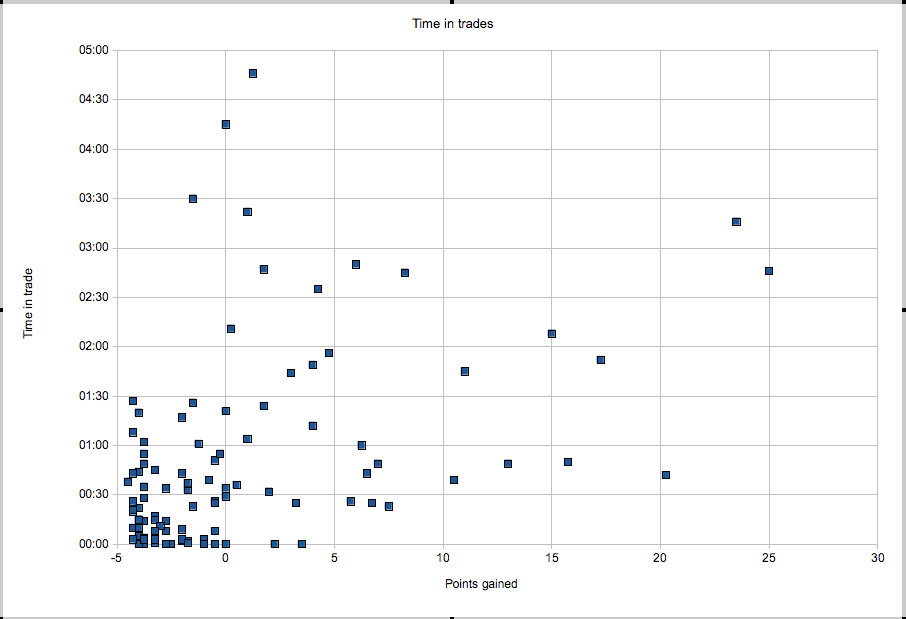
Clearly if a trade isn't working after a lengthy period, it's better to close it, rather than leave it running.


I'm still ongoing with my analysis of my indicator performance with Multicharts. I had thought that an ideal scenario would be one where I have some code written (or purchased) that will auto detect the type of chart patterns I like to trade. That said, it's unlikely to be as good as the brain at detection. There's some clear evidence of this in a project Miss PositiveDeviant is taking part in called PlanetHunters http://www.planethunters.org/. Essentially what NASA have done is provide a lot of potential planet transit data online, for "community scientists" to search through in order to look for patterns that are typical of a planet transit in front of a star. The reason they did this is because they recognise that the human mind is better at pattern detection than computers are. Miss Positive Deviant actually found a new planet and this was confirmed by the project team, she was then interviewed by some of the people involved in the project at MIT, Yale and Oxford and her name is actually listed in the scientific journal and some other articles online. Unsurprisingly, she doesn't get to name it.


The next chart is, on the left, my performance, and on the right, the performance of the system, that is the results had all of the signals been traded;


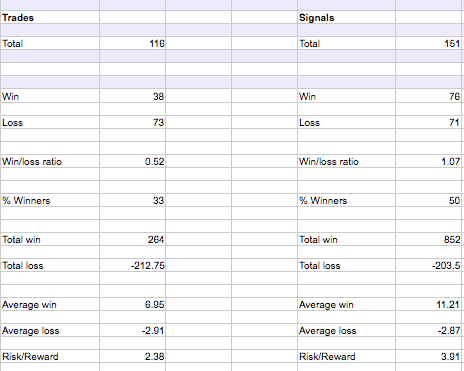
This really shows exactly what happens if you take a system and only trade some of the signals. The performance is dramatically different. Although I made a profit over the period, it's nothing compared to the potential that is there. I guess X% of new futures traders are down at the six month point, not up as I am. But I take little comfort in that since I want to be much closer to the right, than the left. It is somewhat curious that some of the trades I missed were big ones, and since the system takes most of the profits from a few big trades, that really hurts the profitability.

An analogy of futures trading is a Formula 1 racing team;

The car has to be well designed
The car has to be well set up for the track
The car has to be reliable
The car has to be consistent
The mechanics need to be experts in their field
The team needs strong leadership for motivation
The driver needs to be fit
The driver needs to be motivated
The driver needs to know the track well
The driver needs to be very competitive

If any one of these aspects falters then it strongly impacts the result.

Sunday 16 October 2011

What systems you are using, and which books have influenced your style?

Someone on another forum asked me;

[quote name='Capitalist Pig' timestamp='1318622947' post='229229']
Hi PosDev.

I will be interested to know how you first fell into trend following, what systems you are using, and which books have influenced your style?

Warm regards
[/quote]


My repsonse;

Hi there, I'm interested to know why you think I'm into trend following?

In terms of systems, I've just started using Multicharts.

In terms of style of approach, the main one has been The Alchemy of Finance by George Soros. Chapter 3 page 74; he starts explaining how he created a model to try and understand currency movements. He took variables eg

nominal exchange rate = e
nominal interest rate = i
Trade balance = T

and then used those (and others) to build a model.

Something interesting he said was;

"Two general observations can be made. One is that relationships tend to be circular; that is, variables can serve as both cause and effect in relation to other variables".

What I took that to mean was, in any system where you have interacting variables how much can you learn by say, only selecting two of them, and looking at how they relate to each other?

Or, how much can you learn by selecting one variable and then taking a derivative of that and using it as an indicator?

That seems to me to be an approach only using one 1 dimension.

An analogy is, if you take a patient who is showing symptoms typical of a brain tumor, and put them through a CAT scan where you can see only 1 2D "slice" of the brain at a time, and you choose to look at only one of perhaps 300 slices, what sort of conclusion could you reach by only looking at 1 slice? Probably not a very sound one.

So to enable me to look at relationships of groups of variables (stocks, currencies, bonds and commodities - since they all influence each other), I created my own model, and then charted it. It's my DBDT indicator. Essentially I use many variables in it but include the stock, ETF or future that I want to analyse, before I chart it. When I first did this, I spotted that double tops on it made good sell points, and double bottoms were good for buy signals. So that has influenced my style of trading turning points.

This is it working on GDX. GDX is in blue, my indicator in black;


I've shown points 1 to 6, each of which are signals, either a double bottom for a buy signal or a double top for a sell signal;

Points 1 - 6

1) Buy 28th April 2010
2) Buy 30th July 2010
3) Sell 3rd January 2011
4) Buy 26th January 2011
5) Buy 12th July 2011
6) Sell 19th July 2011

Points 1 - 6 on a more standard type of chart;


Also, the first chart zoomed out to show a longer timeframe;

GDX is in blue, my indicator in black - May 2008 to present;


What's interesting on this one is a significant buy signal on 5th October this year. It's significant because where the double bottom has formed over a much larger timeframe, it has previously meant a more accurate signal. Since GDX moves largely similar to Gold, and therefore signals on my DBDT indicator working on GDX can be translated into being a signal for gold, I bought gold that day.

It will be interesting to see in the future if that signal marks a significant low in gold and GDX.


Going back to looking at relationships between groups of variables, I've been thinking about a new way to chart these, and will try to do that at some point, to see if anything interesting results from that.


Regards books Victor Niederhoffer's, Education of a Speculator and Practical Speculation are great. I took something away from those also.


-------------------------------------------------

Regards my Skype meeting with Jeff Quinto, our availability doesn't match up for next week, so has been set for 26th October.

Thursday 13 October 2011

An opportunity to talk with a futures trading veteran

I just took part in a webinar organised by my broker, Mirus Futures - "How to Design Your Own Unique Theory of Trading", by Jeff Quinto.  During the webinar he held a competition for a free hour's mentoring with the fastest to answer three questions winning the prize.

I won. :rolleyes:


From the CME website;

"Jeff Quinto is a 37-year veteran futures trader and a world-class  trading coach. He has trained hundreds of electronic traders, including  traders from Hong Kong, France, Slovenia, England, Australia, the US and  Canada.

Jeff’s entire career has been spent in the futures business, first as a  commodity specialist with Shearson and, later, as a trader on the Kansas  City Board of Trade floor where he traded wheat and stock index  futures. His company, Jeffrey S. Quinto and Company was a clearing  member of the Kansas City Board of Trade and a member of the Chicago  Board of Trade. In the nineties, Jeff served as President of Rand  Financial Services, a large Chicago-based futures clearing firm.

From 2000 to 2005, Jeff was responsible for training traders at an  all-electronic proprietary trading firm located in Chicago and Vienna,  Austria in which he was a partner.

Today, Jeff coaches electronic futures traders from around the world in his Electronic Trader Mentoring Program and in his Upgrading Your Trading Course. "

Some notes from the webinar;

Jeff Quinto's Theory of Trading

"Jeff Quinto has been called "America's Preeminent Futures Trading  Mentor".  Jeff is a 37-year veteran futures trader, former CME member  and a world-class trading coach.  He has coached hundreds of futures  traders, including traders from Hong Kong, France, Slovenia, England,  Australia, the US and Canada.

Jeff strongly believes that professional traders are world-class  competitors, comparable to professional golfers, top tennis players, and  Olympic athletes.  None of these competitors could have achieved their  top-ranked status without first having a world-class coach.

Jeff is that world-class coach for futures traders.
"


He was talking about a time earlier in his career when he was working at the Kansas City Board of Trade; it was 1982 when they introduced Value Line Futures, making Kansas City Board of Trade the first exchange to offer a stock index futures contract.   Average trade size was 10 to 20 contracts and he took an order from Paul Tudor Jones for 1000 contracts at 50 points higher than the market. At the time the order was equal to 50% of the daily volume in the market and he had to try and fill it.  The market rallied sharply, passing the order price before he could get it all on.  That must have been a trade pretty early on in Paul Tudor Jones' career.


He's looking to get something set up for next week. It'll be real interesting getting some guidance from a futures trading veteran.


There was a discussion about him over at the Trade2Win website, one of the comments was;

"I am head  trader for a hedge fund and have been using Jeff Quinto's   coaching for  over 3 years.  He saved my career once when I got into a   hole and I  intend to continue using his service.  Its certainly not   cheap, but you  get what you pay for in this business and 99% of the   people who offer  such services aren't worth paying a single cent for.   Take him seriously  is my advice."

Wednesday 12 October 2011

More Multicharts

I'm very impressed with the Multicharts platform so far, it seems very stable, each time I chart my indicator it's the same every time. That certainly wasn't the case with ThinkorSwim. In theory it's possible to program Multicharts so that it recognises a trade set up and initiates a trade based on your pre-set parameters, so your strategy can be fully automated. Realistically, this isn't an option for me since I don't have a programming background and it would probably take an inordinate amount of time to learn how to program it, and then test it to make sure it was working as directed.

I picked out some signals today on ES (E-Mini S&P) whilst getting my new workstation set-up.

DBDT indicator chart


For anyone new to my journal, previously I've taken signals on my indicator working on various indices as trade signals for the E-Mini NASDAQ

Equivalent points on NQ (E-Mini NASDAQ) today;

Green = buy signal time/price
Red = sell signal time/price

Some directionally good signals there.

Saturday 8 October 2011

Friday 7 October 2011

Multicharts

A two hour meeting at work progressed in such a manner that even the colours in the room were seeping from the walls trying to escape, the dye in the carpet was doing it's best to reach the door, not wishing to be associated with the grey and desolate reality of the dis-jointed letters uttered by the mouth that we were supposed to be listening to but could only see open and close as my mind drifted to somewhere much, much more interesting.

I received Windows 7 yesterday, I'm sure it's a fake copy actually, even though I installed it, the authorisation key worked and the online validation worked - such is paranoi after having been ripped off previously.
(Also see - Pavlov)

It's taken me 5 hours to become aquainted with, and figure out how to program my indicator into, Multicharts.  I'm making progress, not as fast as I'd like but since I thought Multicharts would be quite daunting, with it's 905 page manual, I realise it's not so bad and so far we appear to have hit it off, although I'm not prepared to propose just yet.
Google Multicharts if you want to know more. I'd heard of it before via www.bigmiketrading.com but knew nothing of it and paid no attention to it until I was forced from my laptop into the lap of Bill Gates after ThinkorSwim rudely interrupted my trading back in August. I will admit I am pleasantly surprised with Windows 7, it doesn't seem as intuitive as Max OS X, but that may be since I've become too accustomed to using the Mac over the years.


My DBDT indicator working on NASDAQ (on ThinkorSwim);


My DBDT indicator working on NASDAQ (on Multicharts);


Similar but different, for some reason the end number is not the same, perhaps I'll figure it out tomorrow...

Wednesday 5 October 2011

Have we seen the low in Gold?


This is gold futures covering 12 months shown within a linear regression trend channel, it's not drawn by me, it's calculated automatically.  I've set the regression channel to show the median line, the outermost lines of the channel represent 3 standard deviations from the mean, and the ones inside are 2 standard deviations from the mean.  Money Flow Index (MFI) is beneath the chart in dark grey.  MFI recently formed a low on 29th September.

The first and second time this indicator bottomed, it marked some form of low in gold.  (Blue vertical dashed lines)

Interestingly, you can also see that the price level gold was at, when MFI was at a low, also marked a key support level in gold, with gold trading back down to the same price level later on, then rallying further.  (Horizontal blue lines). 

What I also find quite interesting is that, on the 2nd and 3rd occasions when the MFI was at a low, the lower 3rd standard deviation line was at the exact price level where MFI made a low previously.  (Grey dots show the intersection between the 3rd standard deviation line and previous MFI low gold price)

That may just be a co-incidence and/or confirmation of the strength of the trend.


It seems unlikely but if that relationship were to continue, then gold would rally somewhat from here, before trading down to $1575 by 8th December 2011.


I bought gold earlier today, without having looked at any of this previously.


This next chart is a proprietary indicator I developed, working on GDX (Gold Miners ETF).


It may look slightly cryptic but it has generated a buy signal for GDX today, previously my indicator signals on GDX have worked well.

Monday 3 October 2011

Waiting to trade...

Well it's all too barren here on my trading journey blog, I seem to have been the victim of some sort of fraudster on Amazon selling Windows 7.   Nothing arrived, it's been over 2 weeks since it was supposedly sent.  Never mind, the card people at the bank will sort that out.  Meantime I bought another Windows 7 online - let's hope this one turns up.

I've not been looking at what my indicators have been doing since I can't trade just yet, until I get Windows 7 running with Ninjatrader and Investor RT, but I had a look today to see whether it picked anything out of of the action;

Sell signal on YM (E-Mini Dow Jones futures) triggered at 17:05 today;


Equivalent short point on E-Mini NASDAQ;


Entry point based on the indicator sell signal at 17:05 was 2129 on the NASDAQ, my standard trailing stop of 8 points would have been taken out following a bounce, at 2101.75.  That's 27.25 points - a reasonable move. Before I start trading again I'll need to review my 8 point trailing stop, based on the volatility right now it looks like a 10 or perhaps 12 point trailing stop would be more appropriate.

I really hope we are moving into a long term bear market since my system has typically netted more points on the downside, and I want to take advantage of that.