I just reinvested 25% of my silver profits into Gold bullion, a no-brainer for me really. I have a lot of dollars in a trading account so it's a nice hedge for that, I am not convinced of the view that there will be hyperinflation at some point, nor that gold will ever be part of a monetary unit. However, I realise I could easily be wrong and want to hedge against that. If there is one thing you can count on, it's for politicians to repeatedly make bad decisions. I am quite sure that if gold were to be considered as part of a monetary unit, it will be the very last option available on the table, and by that time things could be a real mess. I've done very well indeed with silver, but it's far less well rounded as a hedge than gold is.
I may put another 25% of profits in over the next few days. I'm keeping the rest since if the precious metals story turns out to be complete bolshoi longer term, I still have the gains to show for it.
I'm a fan of Moses Kim from expectedreturnsblog.com, he seems quite shrewd and reckons there's more to come on the downside. His latest post;
Gold's Collapse Continues
"As I write this, gold is trading at $1591 in the overnight markets, after trading as low as $1531. Surprised? You shouldn't be. Gold was overstretched and needed a breather. I am actually starting to think we will see gold in the $1400 range.
Gold has monster corrections all the time, yet people are surprised when they come. Every time gold rallies, gold bugs say the world is ending and hyperinflation is imminent. This doesn't make sense to me. Treasuries are hitting high after high, which means the interest payments on our debt are holding stable, and somehow gold is supposed to skyrocket? Let's be objective here.
True believers in gold should take a one month vacation and not even look at the price of gold. When your vacation is over, buy gold at whatever price it's trading at. I honestly believe this is a better strategy for most people than the alternative, which is to constantly monitor gold prices and buy and sell in an emotional frenzy. Let gold bounce off the 200-day moving average, then let's start talking about a rally."
As an aside William Patalon III, Executive Editor, Money Morning posted a story on 20th September, the headline -
Why We Know Gold Prices Are Headed Higher
You gotta love it, gold now $200 lower. I'll be paying close attention to this guy in the future!
-------------------
As regards futures trading, I still haven't received my copy of Windows 7 that I ordered that I need so I can run the PC software provided by my broker. I ordered it from Amazon, delivery date states between 22nd September and 4th October...
I can't complain since it's still within the "delivery window", I'll just need to be patient.
Monday 26 September 2011
Post date 23rd September (forgot to post this at the time...)
I think this may be the end of the cyclical bull market in silver. As a result of yesterday's drop my NAV dropped by 2.6%.
Previously in April, I bought puts on SLV, and sold half of my physical right at the top, I then cashed in the puts between $33.75 and $35, and bought back my physical position at $37. At the time people were rubbishing the idea of it being a top (apart from Bubb). My thinking was that the bull market would continue, but that the price would have to reach and exceed $50 for this to be confirmed to be the case in my mind. Selling after a drop is not typically what you do in markets, however, the meaning of yesterday's price action and the price action in the markets from a macro perspective could be very significant in my opinion.
After much vacillating, late yesterday I sold my entire physical silver position for US Dollars, I got out at $36.4. I am now entirely in cash.
Today I see silver down a further 10%, so at the moment it looks like the correct decision, but it's too early to say.
Only time will tell.
Tuesday 20 September 2011
NASDAQ diverging from other indices
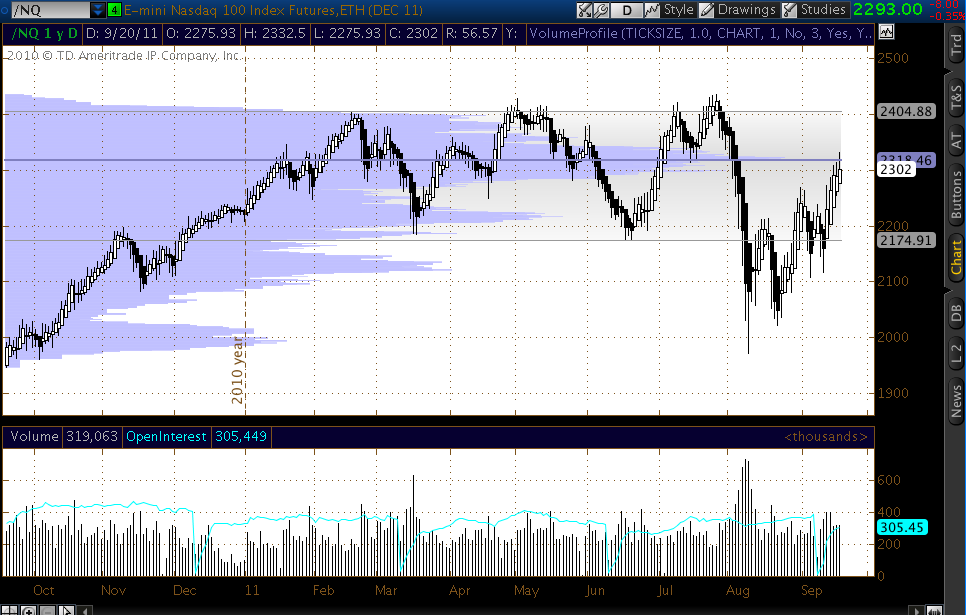
I've not really been checking my indicators of late since I can't trade right now but thought I'd I'd post this, a sell signal on the NASDAQ that triggered on the close yesterday;
DBDT sell signal E-Mini NASDAQ - 1 year chart
E-Mini NASDAQ - 1 year chart;
This is NYSE composite with Dow Jones Transporation Index and SPX;
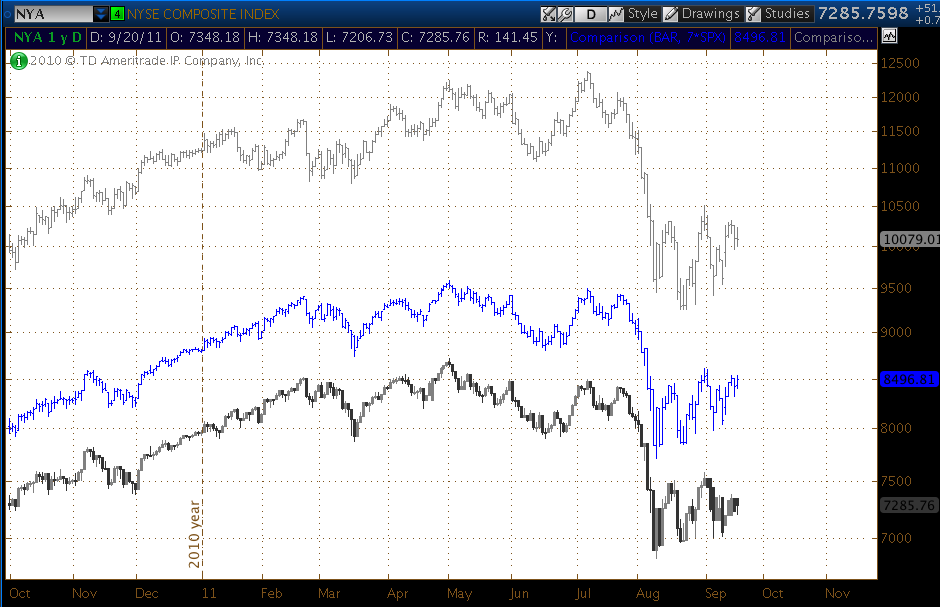
Divergence between the NASDAQ and these the indices.
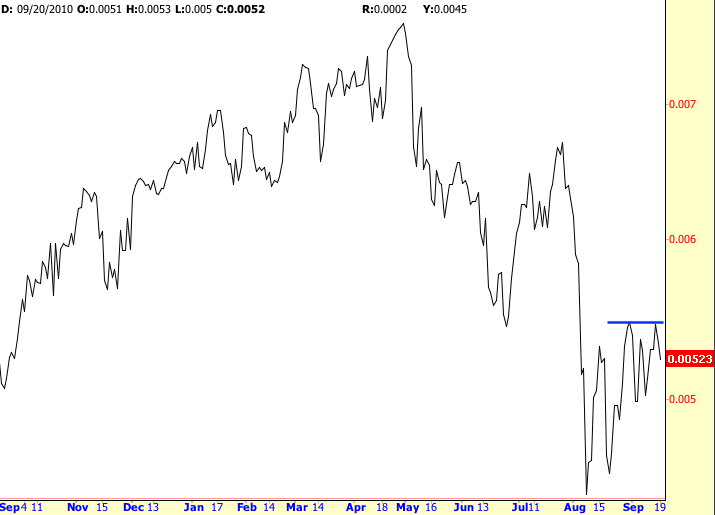
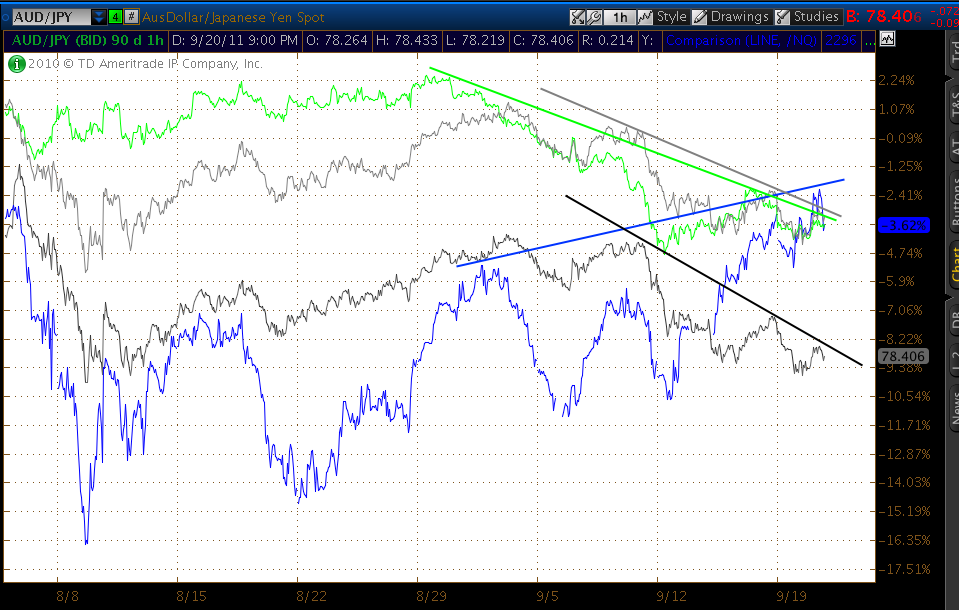
And divergence between the E-Mini NASDAQ and AUD/JPY, EUR/USD and AUD/USD - 6 week chart;
DBDT sell signal E-Mini NASDAQ - 1 year chart
E-Mini NASDAQ - 1 year chart;
This is NYSE composite with Dow Jones Transporation Index and SPX;
Divergence between the NASDAQ and these the indices.
And divergence between the E-Mini NASDAQ and AUD/JPY, EUR/USD and AUD/USD - 6 week chart;
A review of www.sentimenTrader.com

There are a seemingly endless supply of technical indicators a trader or investor can choose from, and since many are derived solely from one data series - the price of a security, it's important to complement these by including sentiment indicators as part of any market analysis.
SentimenTrader began in 2001 and is operated by Jason Goepfert, a trader of 15 years, the founder and president of Sundial Capital Research, Inc.
Sundial's focus is on "the research and practical application of mass psychology to the financial markets". Their work has been mentioned in prominent media such as Barron's, CNN, CNBC, SFO Magazine, The Economist, Reuters, The Wall Street Journal, Active Trader, Futures, TheStreet.com and TradingMarkets.
SentimenTrader is a subcription access website, they offer a 14 day trial with no obligation, along with options to subscribe on a monthly ($25), quarterly ($70) or yearly ($250) basis.
Once you're logged in you find a well organized page with a bar along the top with drop down menus available under most headings, aside from the "Intraday" heading.

Example chart;
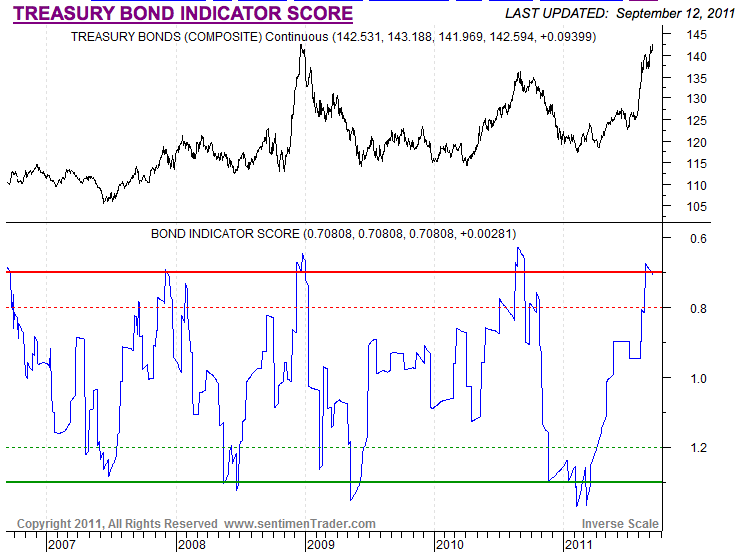
For Bonds, there are indicators for Rydex fund flows, Put/Call ratios, Trader Commitments and Surveys. What caught my eye was the Treasury Bond Indicator Score, this a form of composite indicator proprietary to SentimentTrader where they weighted and combined data from sentiment indicators for the bond market, together with put/call ratios, Rydex mutual fund flows, sentiment surveys and Commitments of Traders data. The result is an overbought/oversold indicator that looks very useful;
For Commodities, there are indicators for Trader Commitments, Public Opinion, Rydex Fund Flow and Individual Contracts. For the Individual Contracts, all major Currencies, Energy, Metals, Grains, Softs and Meat contracts are covered, although it should be noted that Platinum and Palladium are not featured. Seasonality charts are also available for each contract listed within the Individual Contracts section.
The "Public Opinion" charts are of notable interest, an excerpt from an explanation on the website;
"To calculate this gauge of public opinion, we have created an index based on many of the established surveys currently in existence, some of which are noted below. We have looked at the history of the surveys to determine how accurately they have measured extremes in the past, and weighted their influence in our indicator appropriately based off that analysis."
The following is SentimenTrader's Public Opinion chart for silver as it was towards the end of April 2011;

This chart played an important role in my analysis of the silver market back then, I was not a subscriber back then, but I found this chart and it led me to their website. The analysis was posted on Green Energy Investors (GEI), with others contributing theirs also, in a collaborative effort that led to a very accurate and profitable top call in silver. Even some of the non-traders took action, such as swapping silver for gold.
The initial thread on GEI that started that process, can be found at: "$50-ish Peak in Silver Coming? Hunting the Top "
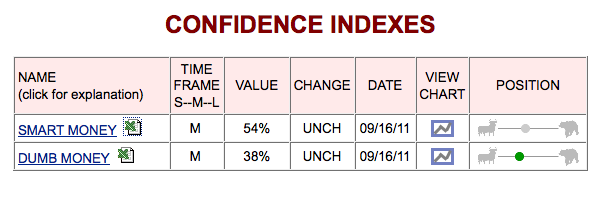
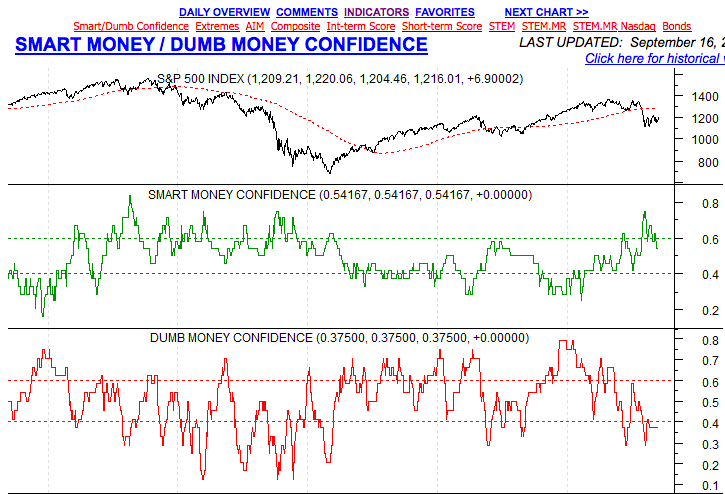
Moving on to the Models section, these are also proprietary to SentimenTrader;
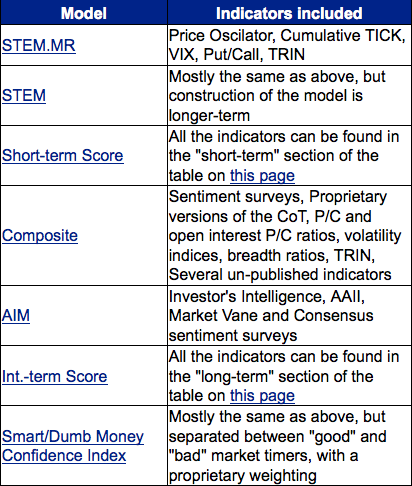
In a similar vein to the Treasury Bond Indicator Score these are weighted composites of sentiment indicators, also depicted as oscillators, suggesting overbought/oversold conditions. These are offered over a variety of timeframes, from intraday to a few days, weeks or months. Since I mainly trade E-Mini NASDAQ futures the STEM.MR NASDAQ is of potential interest (although I haven't properly studied it yet) and could be useful as a filter for trading signals from other indicators, as it suggests points where rallies may be overdone, and where sell-off's may be nearing an end.
The charts on the Intraday section show two week periods for the S&P 500 and NASDAQ 100, and are updated every 15 minutes, charts showing the STEM.MR model are shown beneath each, along with cumulative tick, a price oscillator, breadth charts, VIX and Put/Call ratios. This isn't part of the site I generally use since I prefer to have my own charts set up through my trading platform with my own settings applied however for those not at their normal workstation it's helpful to have on the site, rather than you having to look elsewhere.
Finally, under the More section you can find seasonality charts for each month of the year for the S&P 500 with data covering 1950 - 2006. You can also check seasonal performance of the S&P 500 around various holidays eg Labor Day, New Year's Day etc. This is an interesting feature I haven't come across before and allows you to quickly gain an understanding of market activity around various seasonal dates.
Other features I like from this website are the Sentiment Summary on the main page that gives a brief run down for the day and some commentary, both on a 1 to 5 day and 1 to 3 month basis. As a subscriber you also get a daily email with interesting commentary and analysis including general equity market indicators, and also details and analysis of the top sentiment stories, the most recent being about a Wall Street research report highlighting a long-term sell signal from the Coppock Curve indicator. You can also create a list of your favorite charts, saving you time when you want to refer back to your preferred charts.
Overall I think sentimenTrader is well worth the subscription. The fact that all of the information is well organized and formatted makes it very user friendly and they've covered a lot of bases with the range of content, making it appealing to both the trading and investing community. I'm also a big fan of their proprietary indicators.
Recommended.
Tuesday 6 September 2011
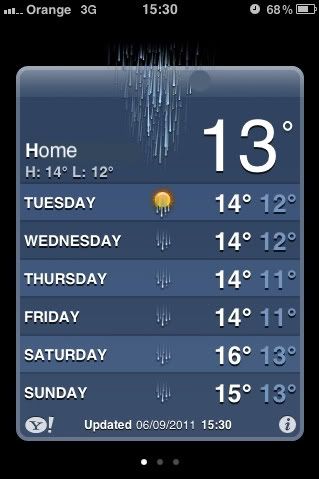
Back in the UK
I'm baaaaack, and boy is it freezing back home. It's no wonder so many brits head mediterranean bound each year, (and in the twilight of their years).


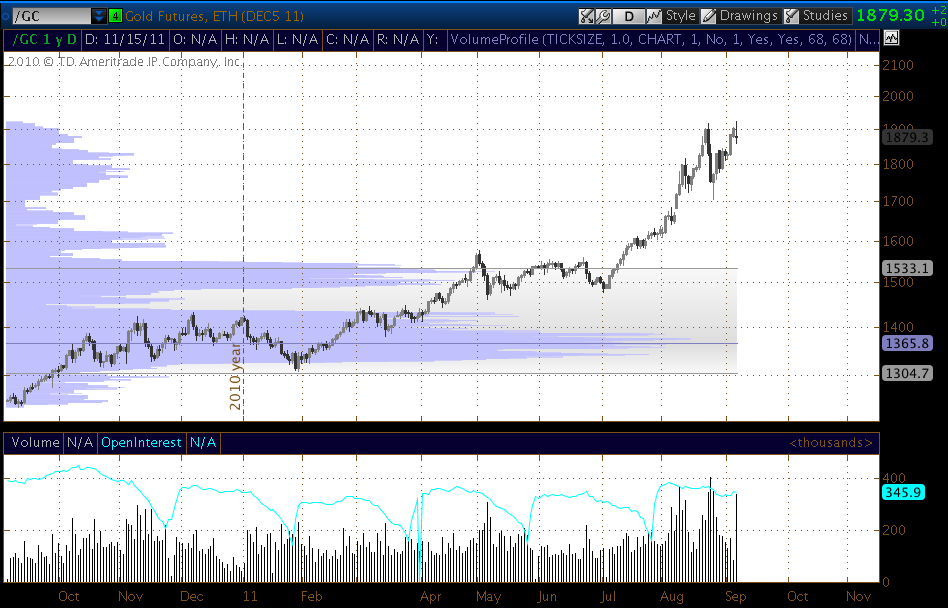
It looks as though my call for a potential "Silver style" correction in gold hasn't borne out, although the next few days should be interesting since gold may be forming a double top;
Gold futures;
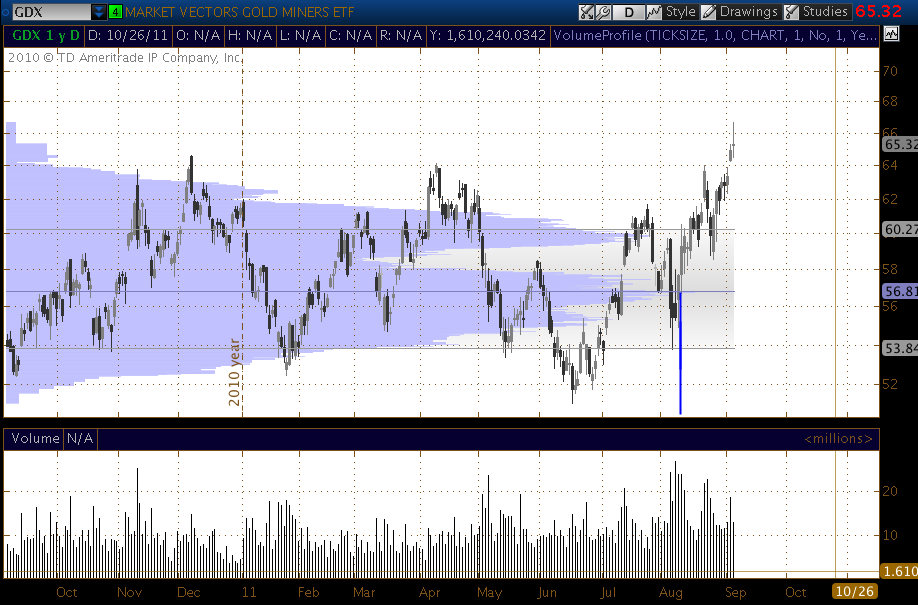
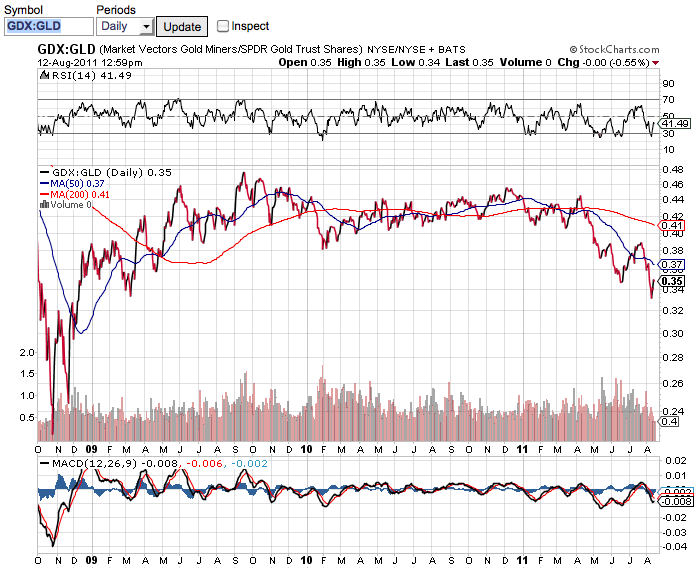
I made a very good call on GDX (Gold miners) back on 10th August on the gold thread on www.GlobalEdgeInvestors.com
GDX today with 10th August marked;
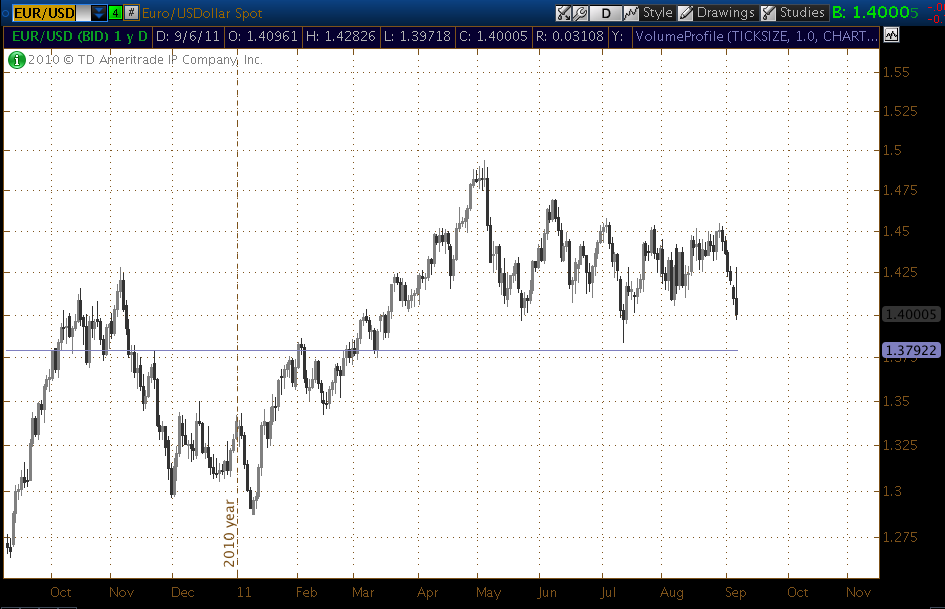
I also made a good call on EUR/USD before my trip abroad;
EUR/USD today;
I would have lost buying puts on GLD but made decent gains on the other two had I not been without a broker. ThinkorSwim no longer offer brokerage services outside the US and Canada, before my holiday I'd instructed a new broker Mirus Futures to organise the account transfer from TOS to them. Nothing has happened. I'm having second thoughts about Mirus, I spoke to them on the phone before my break and they told me not to worry, everything will be sorted blah blah blah.
I'm now going to review my options regarding a new broker - Mirus have not inspired me with confidence. They might have at least emailed me if there was a problem, but there hasn't been any email or phone message left from them. On the plus side TOS advised me that my account would be closed and I still have login access, including to the Prophet charts I use to calculate my indicator charts, so that is very useful. I can't count on it lasting though.
It looks as though my call for a potential "Silver style" correction in gold hasn't borne out, although the next few days should be interesting since gold may be forming a double top;
Gold futures;
I made a very good call on GDX (Gold miners) back on 10th August on the gold thread on www.GlobalEdgeInvestors.com
"
Gold topped on 20th Feb 2009, 2 weeks before the stock market bottomed.
I just checked my proprietary DBDT indicator and it gave a buy signal on GDX by the close of trade on 10th August. That's quite interesting for me since historically my indicator has been reasonably accurate with GDX.
GDX buy signal 10th August;
GDX 1 year;
Also a buy signal on XAU (Gold/Silver index)
If gold remains at elevated levels and crude remains suppressed then I would certainly think there is a strong chance of a very large upward breakout for the gold miners."
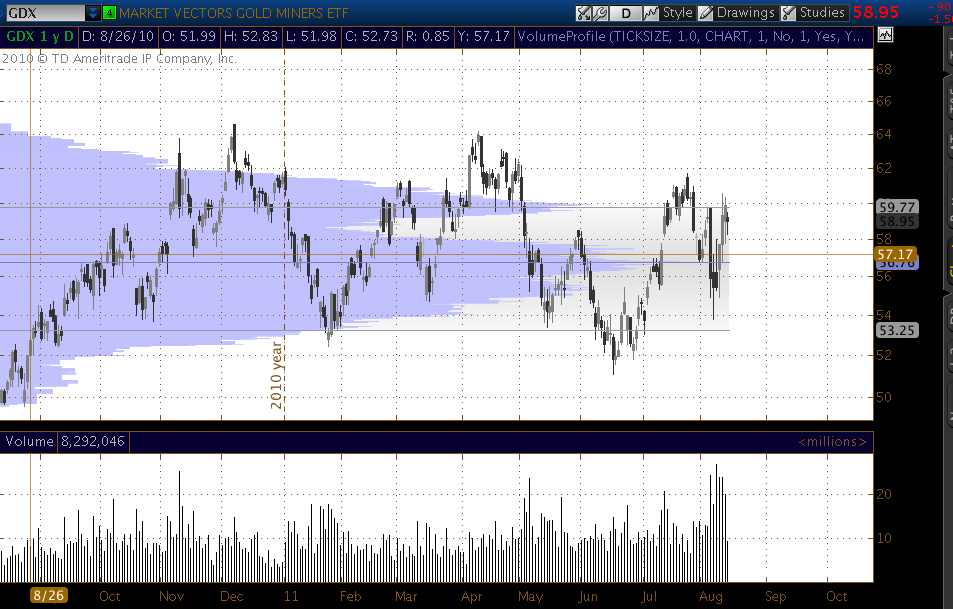
GDX today with 10th August marked;
I also made a good call on EUR/USD before my trip abroad;
"
And how about the ugly sister?;
EUR/USD
The first word that came to mind here is - Precarious. If I could still trade through ThinkorSwim right now I would be minded to buy some FXE puts here."
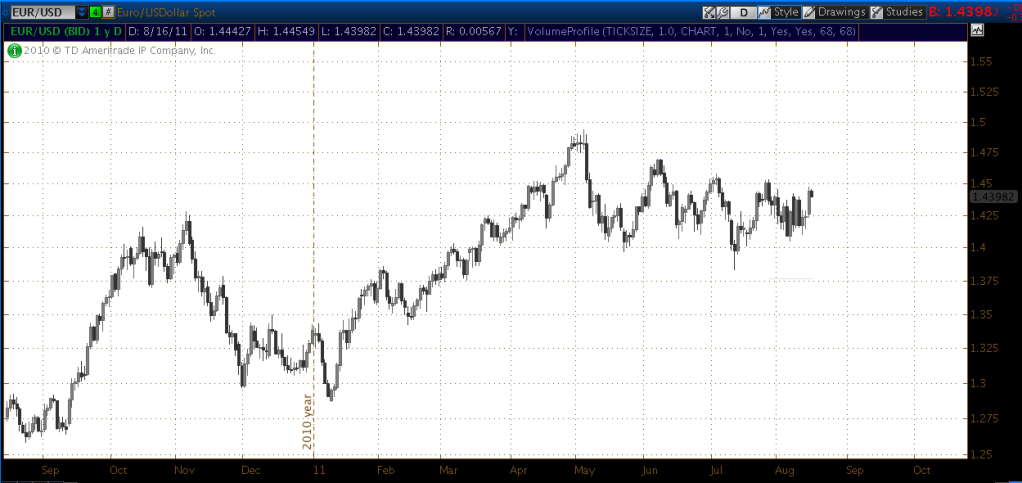
EUR/USD today;
I would have lost buying puts on GLD but made decent gains on the other two had I not been without a broker. ThinkorSwim no longer offer brokerage services outside the US and Canada, before my holiday I'd instructed a new broker Mirus Futures to organise the account transfer from TOS to them. Nothing has happened. I'm having second thoughts about Mirus, I spoke to them on the phone before my break and they told me not to worry, everything will be sorted blah blah blah.
I'm now going to review my options regarding a new broker - Mirus have not inspired me with confidence. They might have at least emailed me if there was a problem, but there hasn't been any email or phone message left from them. On the plus side TOS advised me that my account would be closed and I still have login access, including to the Prophet charts I use to calculate my indicator charts, so that is very useful. I can't count on it lasting though.
Subscribe to:
Posts (Atom)