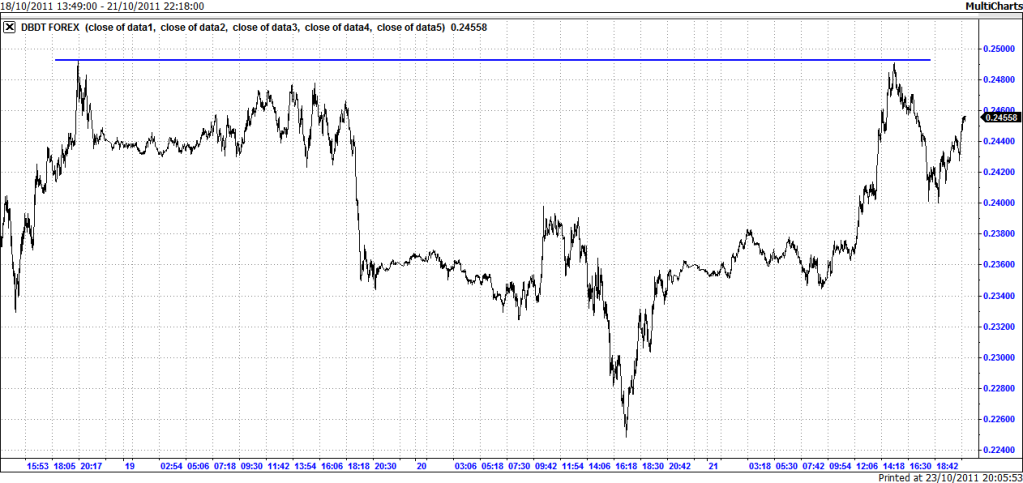
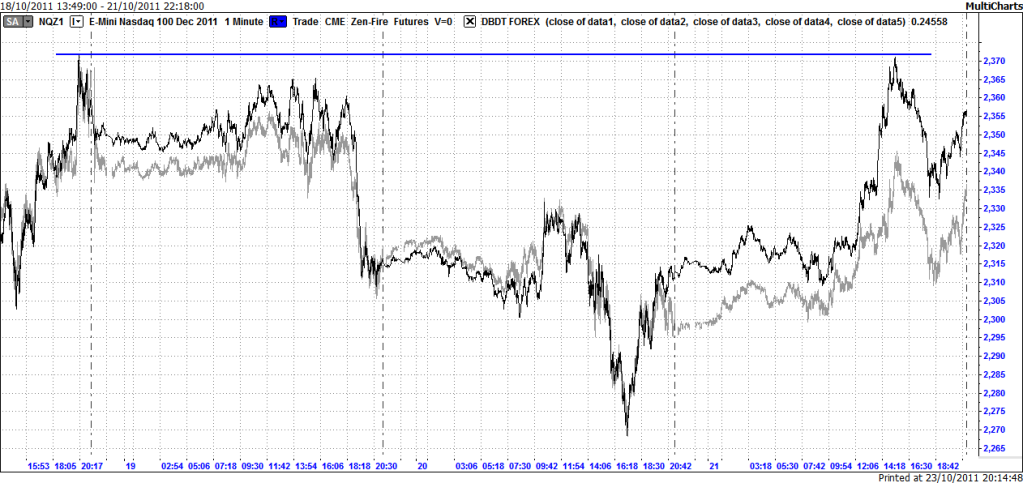
It's not as simple as it sounds however, I found an indicator that can highlight these points but it can only do so on a chart of data for an underlying (eg S&P500 or NASDAQ futures) not an indicator plot such as mine above. If I were able to do this it would be the first step to be able to systematically analyse trade set-ups using my indicator, rather than doing it manually. If I could do that I'm sure it could provide some interesting insights into where I should be directing my energy however it's beyond my ability to do at the moment since I'm not conversant with Easy Language (the programming language you can use to create indicators/strategies on Multicharts).
My indicator in black with the E-Mini NASDAQ in grey
No comments:
Post a Comment