[quote name='Capitalist Pig' timestamp='1318622947' post='229229']
Hi PosDev.
I will be interested to know how you first fell into trend following, what systems you are using, and which books have influenced your style?
Warm regards
[/quote]
My repsonse;
Hi there, I'm interested to know why you think I'm into trend following?
In terms of systems, I've just started using Multicharts.
In terms of style of approach, the main one has been The Alchemy of Finance by George Soros. Chapter 3 page 74; he starts explaining how he created a model to try and understand currency movements. He took variables eg
nominal exchange rate = e
nominal interest rate = i
Trade balance = T
and then used those (and others) to build a model.
Something interesting he said was;
"Two general observations can be made. One is that relationships tend to be circular; that is, variables can serve as both cause and effect in relation to other variables".
What I took that to mean was, in any system where you have interacting variables how much can you learn by say, only selecting two of them, and looking at how they relate to each other?
Or, how much can you learn by selecting one variable and then taking a derivative of that and using it as an indicator?
That seems to me to be an approach only using one 1 dimension.
An analogy is, if you take a patient who is showing symptoms typical of a brain tumor, and put them through a CAT scan where you can see only 1 2D "slice" of the brain at a time, and you choose to look at only one of perhaps 300 slices, what sort of conclusion could you reach by only looking at 1 slice? Probably not a very sound one.
So to enable me to look at relationships of groups of variables (stocks, currencies, bonds and commodities - since they all influence each other), I created my own model, and then charted it. It's my DBDT indicator. Essentially I use many variables in it but include the stock, ETF or future that I want to analyse, before I chart it. When I first did this, I spotted that double tops on it made good sell points, and double bottoms were good for buy signals. So that has influenced my style of trading turning points.
This is it working on GDX. GDX is in blue, my indicator in black;
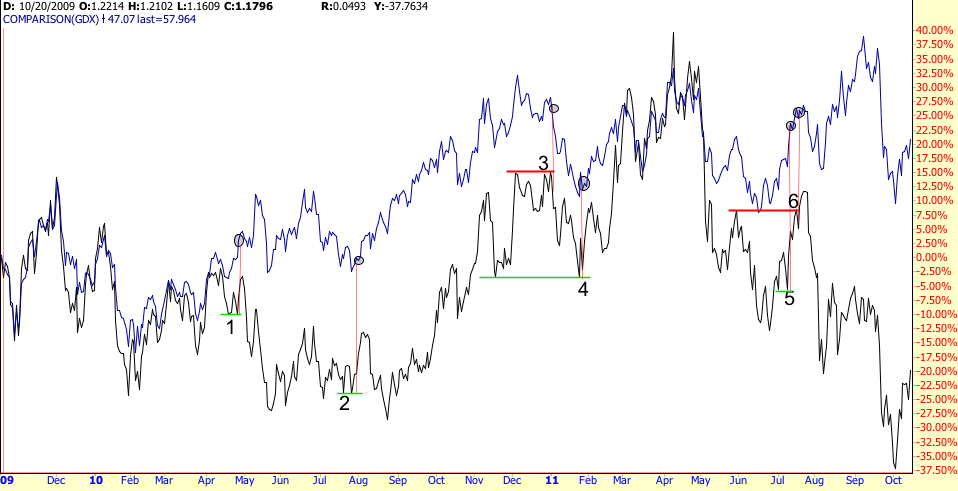
I've shown points 1 to 6, each of which are signals, either a double bottom for a buy signal or a double top for a sell signal;
Points 1 - 6
1) Buy 28th April 2010
2) Buy 30th July 2010
3) Sell 3rd January 2011
4) Buy 26th January 2011
5) Buy 12th July 2011
6) Sell 19th July 2011
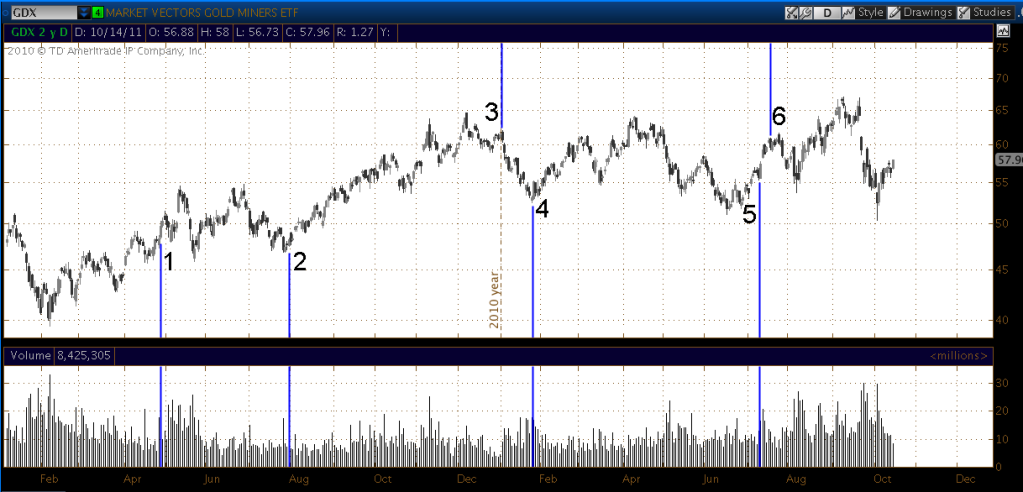
Points 1 - 6 on a more standard type of chart;
Also, the first chart zoomed out to show a longer timeframe;
GDX is in blue, my indicator in black - May 2008 to present;
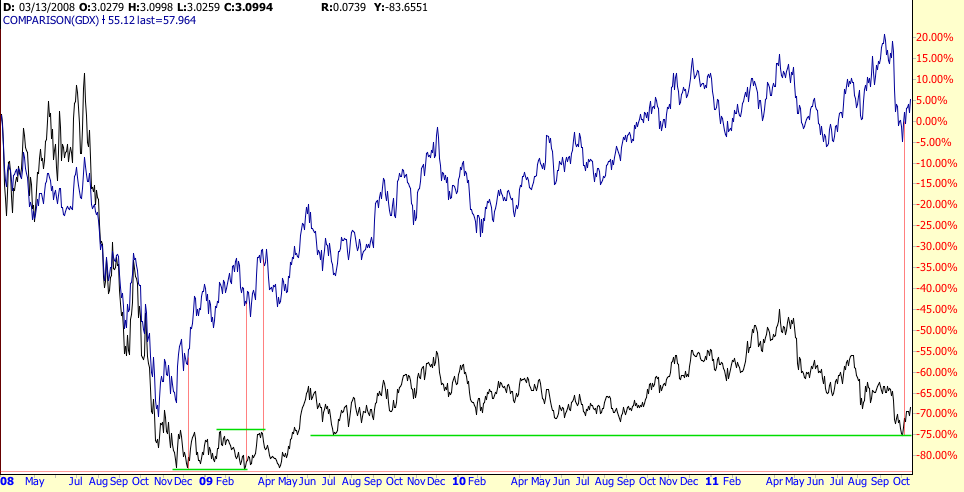
What's interesting on this one is a significant buy signal on 5th October this year. It's significant because where the double bottom has formed over a much larger timeframe, it has previously meant a more accurate signal. Since GDX moves largely similar to Gold, and therefore signals on my DBDT indicator working on GDX can be translated into being a signal for gold, I bought gold that day.
It will be interesting to see in the future if that signal marks a significant low in gold and GDX.
Going back to looking at relationships between groups of variables, I've been thinking about a new way to chart these, and will try to do that at some point, to see if anything interesting results from that.
Regards books Victor Niederhoffer's, Education of a Speculator and Practical Speculation are great. I took something away from those also.
-------------------------------------------------
Regards my Skype meeting with Jeff Quinto, our availability doesn't match up for next week, so has been set for 26th October.
No comments:
Post a Comment