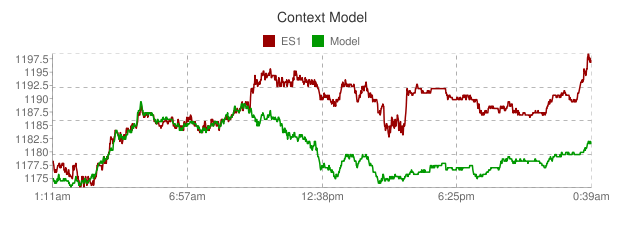
Someone asked them how their model is calculated;
"Consider CONTEXT as being driven by a set of non-linearly dependent (i.e. not linearly correlated) factors including FX Carry, credit, commodities, rates/curves, and swap spreads. Our framework learns individual relationships among all of these factors and ES in order that we can create a quick-and-dirty perspective on how a broad basket of global risk-drivers is behaving relative to US equities.
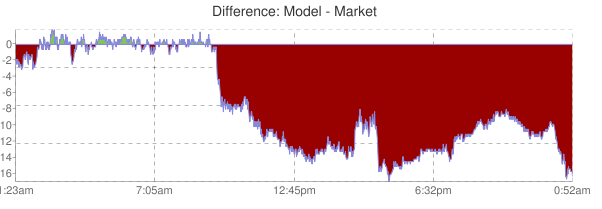
The chart (difference curve as you describe it) is always self-consistent – i.e. there is no running recalibration within the chart (or over-fitting in real-time) as, just as you mention, this would make the framework very hard to use practically (which is our simple goal for our own trading and hopefully for yours). Instead the effort is made on creating a process that uses our experience with these relationships and the market's empirical behavior, along with an understanding on when these relationships change regime, in order to know when a re-calibration is necessary.
The key for us is a framework that has an end-result that is practically useful (identifying market disruptions and pin-pointing specific risk drivers), actionable (whether for flow comprehension, risk support, or in our institutional client's case convergence execution), and easy-to-use.
We hope this helped. Cheers Tim"
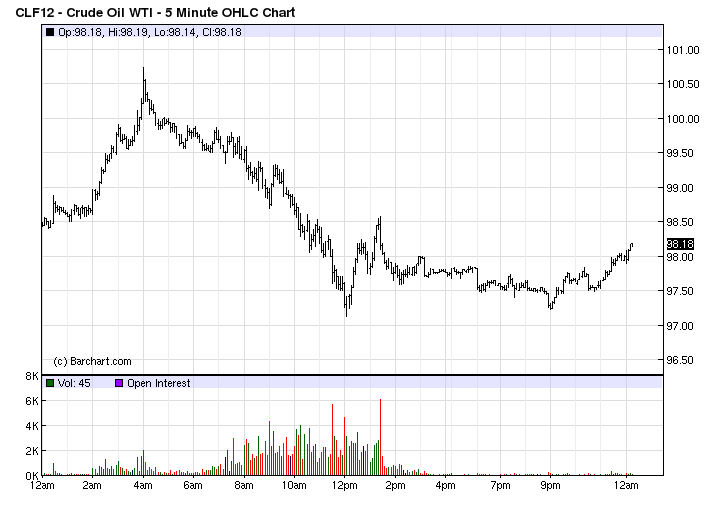
They have a different set variables going into theirs however commodities might have been the cause of yesterday's divergence for both since Crude oil wasn't correlated to equities at all yesterday;
No comments:
Post a Comment