I'm pulling together a number of different elements before I restart trading. That's another ticked off the list.
This break in trading was, at least initially, forced on me by ThinkorSwim ceasing operations in the UK. It's really turned into a blessing, allowing me to re-asses different aspects: broker, internet connection, trading plan etc
I've been spending some time thinking about some of the guidance Jeff Quinto gave me and I'm still working on what the conclusion to that it is, and how I then integrate that into my trading plan. It makes sense to cut costs in my trading business, and one way I can do that is by reducing stop size. One of his statements;
"A trade should work immediately and profoundly"
For each winning trade I had previously I looked at the number of points the trade went against my postion before going in a favourable direction and turning into a winning trade. From those statistics, I found the average stop requirement for winning trades was rather low - 1.29 points. The average is of course just that, some went 3 points against me before working, others just immediately worked and therefore bear out what Jeff is saying, the best trades work straight away. I's quite tempting to simply reduce my stop size to 2 points (from 3.25), this would mean, more stopped out trades, but it would also mean no hanging around waiting for a trade to work. If a trade doesn't work within 2 points of forebearance then I will be quickly taken out of the trades that aren't winners, and left to focus on how I manage those that work immediately and profoundly, as they still have room to flourish.
This also follows the logic of the "Phantom of the Pits", writings by a former floor trader. His rule 1 is that you wait for the market to prove you are correct rather then wait for the market to prove you wrong. Many traders put a position on with a stop. Their view of the position is that if the stop is hit, their position has proved to be wrong, and therefore they have exited the market. There is a subtle but interesting difference between waiting for the market to prove you correct and waiting for it to prove you wrong. Waiting for a position to be proved wrong is a focus on the negative whereas waiting for a position to be proved correct is a focus on the positive. You can only be waiting for the market to prove a position to be correct if you decide that you are only interested in positions that work imediately. And if you decide you are only interested in positions that work immediately then you absolutely must either - reduce your stop size, or - exit postions very quickly if they don't work straight away.
Of course that is only one approach, another method would be to take a more different approach to trade entry. Previously my rules for trade entry were very simple.
1. Signal on my indicator - check
2. Market having moved in the direction of the signal for at least one point during the last one minute bar - check
3. Trade order sent.
That was it. The positive from that was that there is never any question or doubt about getting into a trade, I only needed to check 2 points. The simpler it is, the easier it is to execute efficiently. However, by waiting for the market to move 1 point in my favour, that means I'm losing ground of at least 1 point on a lot of the trades before I even get in.
Another approach may be so look at the average "noise" produced by the market on any given day. The market always has an element of 3 steps forward, 2 steps back, and what I will look at doing is taking advantage of that, perhaps by looking at Keltner channels on a very small timeframe. That way, I could enter postions when the price is at least in the opposing half of the Keltner channel, before initiating a trade, that way I may be able to pick up on that 1 point, previously lost on many trades but still capitalise on the "trades should work immediately and profoundly" aspect. It may allow me to enter the same positions, with 38% less equity risked for a similar outcome trade. It may also lead to some missed trades also though, so I need to study that further.
Ive also been looking at the approach I'm taking with my DBDT indicator, I've tried layering it on top of a chart of the E-Mini NASDAQ (NQ) but it looks quite difficult to read. I've had a persistent interest in why double tops or bottoms tend be a good signals on my indicator. What I mean here is that I tend to get a double top on my indicator where there is no double top on NQ, so what is actually happening there? I've speculated previously on what might be causing that to happen yet hadn't felt close to an answer. Today, I feel much closer. It's divergence. If my indicator produces a double top when the NQ is showing a higher high, then my indicator is diverging in a direction opposing the trend in NQ, hence being classified as a sell signal.
The picture becomes far clearer when I place my DBDT indicator chart side by side with the NQ chart.
So, the top half of the chart is the E-Mini NASDAQ futures (NQ), the bottom half of the chart is my DBDT indicator. For anyone new to my blog here, just look at my indicator as my personal re-valuation of the NASDAQ.
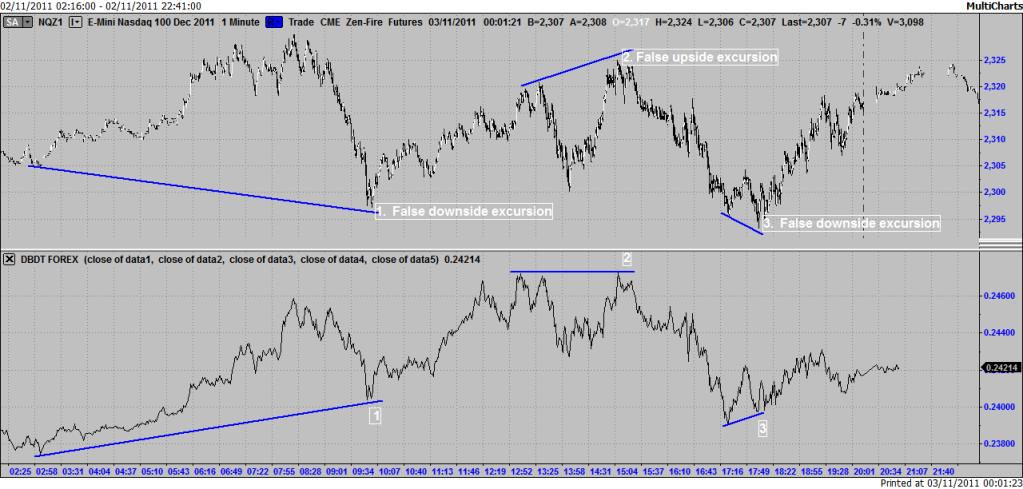
Now this is an interesting chart. What I've shown here is that by looking at my indicator where lows or highs meet, there are occasions where these diverge from NQ in the direction the NQ is about to travel.
Point 1, it's clearly seen that this is a higher low on my DBDT indicator but a lower low on NQ. Shortly after the production of the low, the market then travels in the direction of the DBDT divergence - up.
Point 2, my DBDT indicator is flat whereas as NQ is higher, DBDT diverges away from the direction of the trend, and NQ follows thereafter.
Point 3, a lower low in NQ with a higher low in DBDT, again the market travels in the direction of divergence on DBDT.
Now let's head back to Ray Dalio - Is it true?
Well, it's certainly true of today. Divergence at Point 2 was the high of the session today for NQ. Divergence at point 3 was the low of the session today. So today, divergence on my indicator has pointed to a probable direction of the market in NQ.
Now you can well imagine that if this type of event is a regular occurence then today I have found an altogether new and very interesting direction to take my trading in. Not limiting my trading to double tops or bottoms on my indicator but expanding it to trading these types of divergence events will make sense if I can prove that this isn't simply a one-off. In fact I'm going to make a concerted effort to try and prove that this is wrong.
The market yesterday, 1st November;
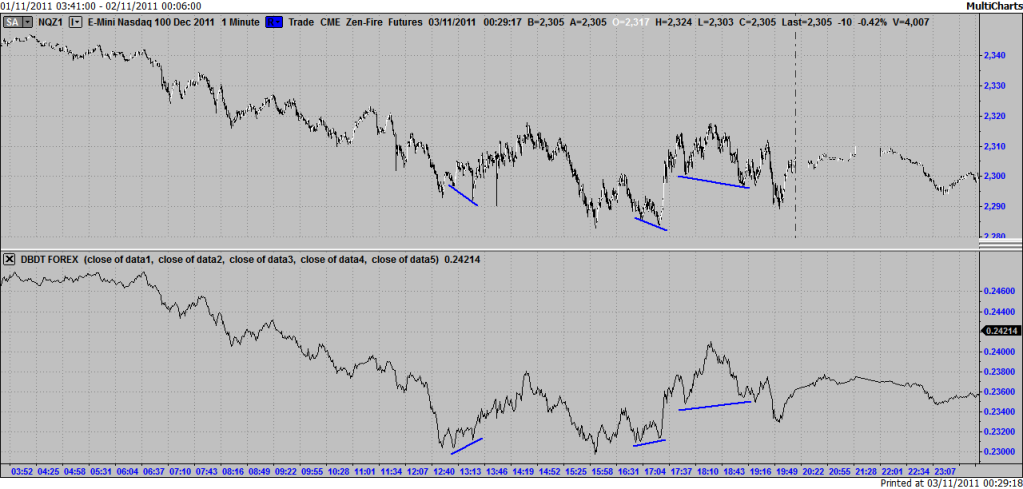
Similar events....
31st October;
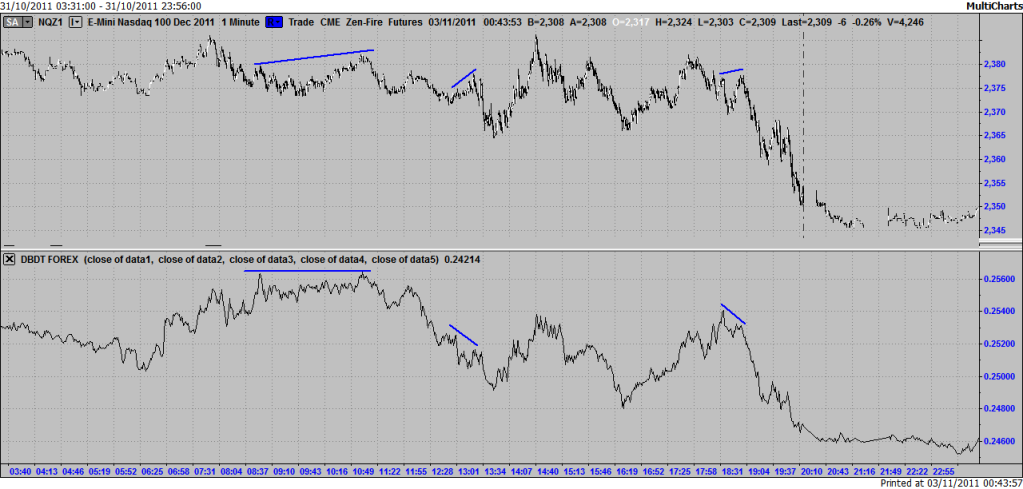
Again (!), similar events.
It's getting late, I'll need to look at this very closely tomorrow.
28th October 2011;
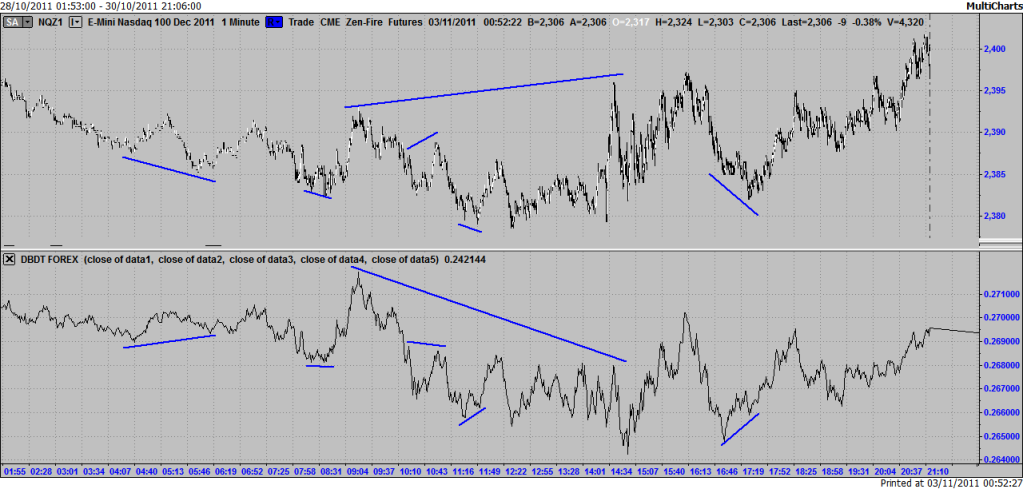
And again....
I remember some time ago, I think it was not long after I came up with my indicator, I had a dream I was talking to a world famous investor and he told me, "You need to look for the second part". I was completely flummoxed by that at the time.
Have I just found "the second part"?
No comments:
Post a Comment