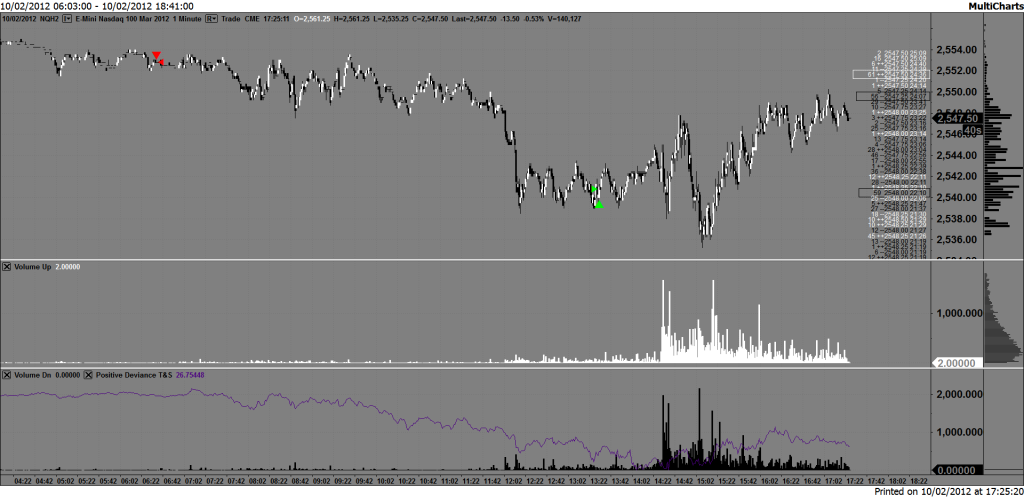
Closed at 13:30 for a gain of 12 points.
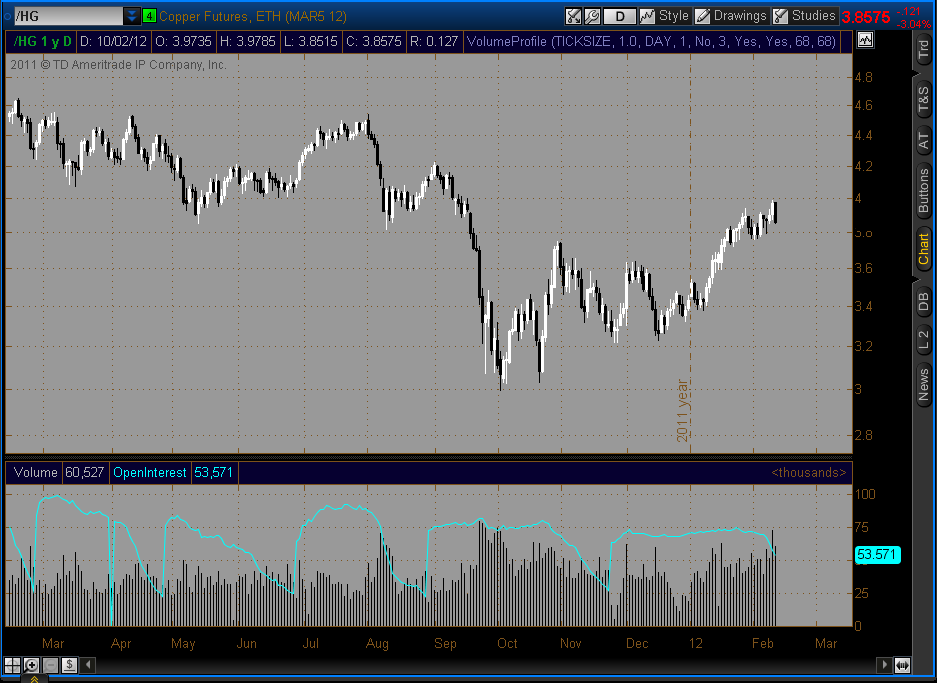
Big move down in Copper today -3%
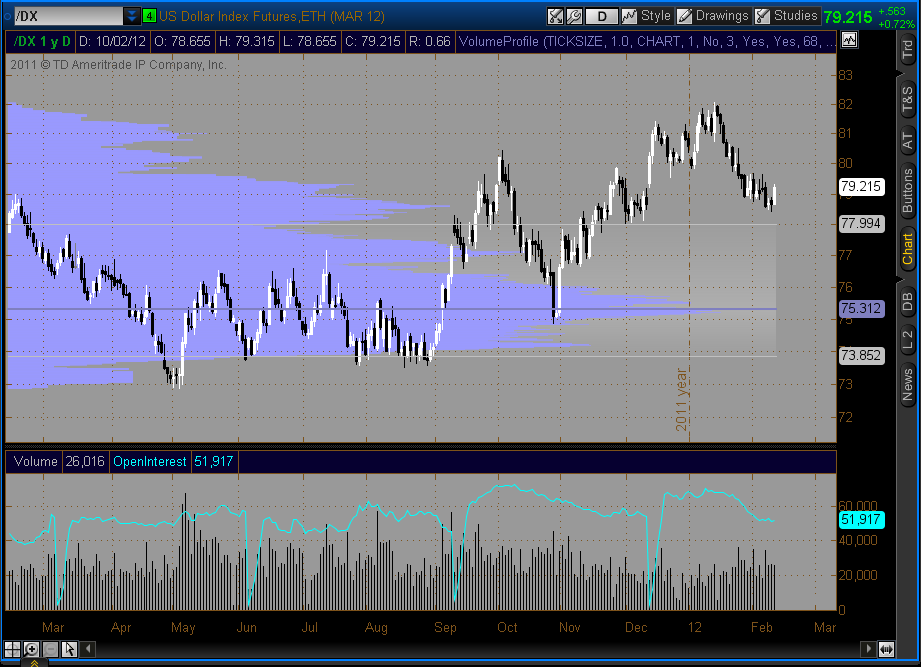
Pop up in the Dollar Index
Also noticed large blocks of NASDAQ futures changing hands today, running into hundreds at a time, more than I typically see.
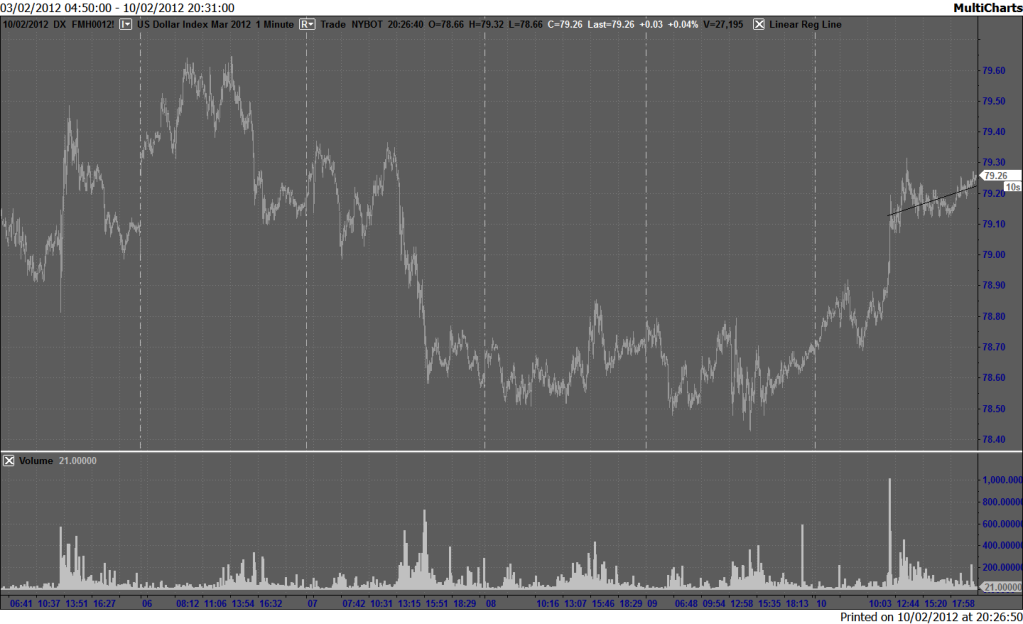
The Dollar Index was making a sustained move higher that looked on target to eclipse the recent high at 78.85, the main reason to short the NASDAQ.
I have a couple of extra screens these days, I usually keep the Dollar Index on one and the following on another;
AUD/JPY, EUR/USD, AUD/USD and NQ;
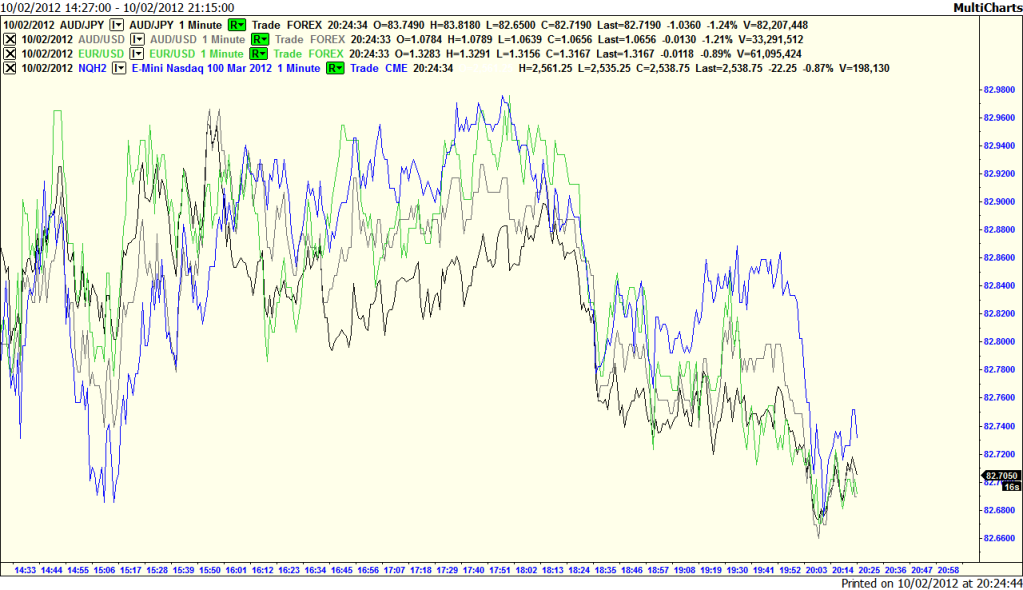
Quite often you can get a lead into how things are going to develop by watching how they interact.
I also watch these futures;
NQ (Emini NASDAQ), ES (E-Mini S&P500), YM (E-Mini Dow) and TF (E-Mini Russell);
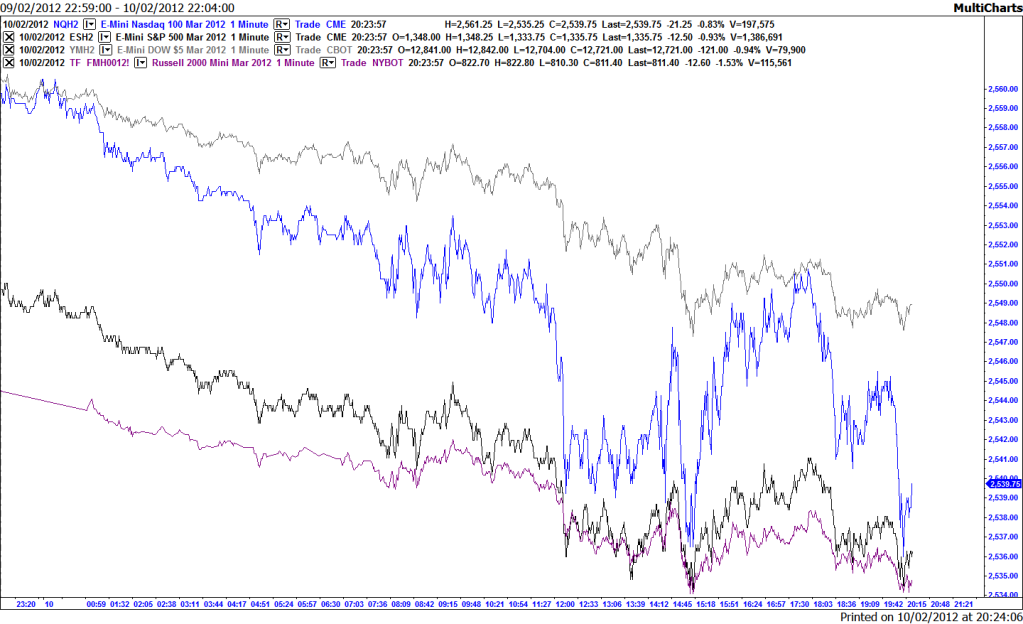
Again, it can be interesting watching for divergences. I find it very interesting, you can see in this chart above that NQ is correlated 1 to 1 with YM at the start of the chart, and this correlation gradually breaks down as the correlation between NQ and ES gradually increases. Then at 3pm this process reverses, the NQ YM correlation seems to near 1-1 again, right around the high of the day session, before it then breaks down, along with the market in general.
I'm starting to put some of my observations into a new trading plan where I use different types of set up depending on the situation.
Currency market divergence setup
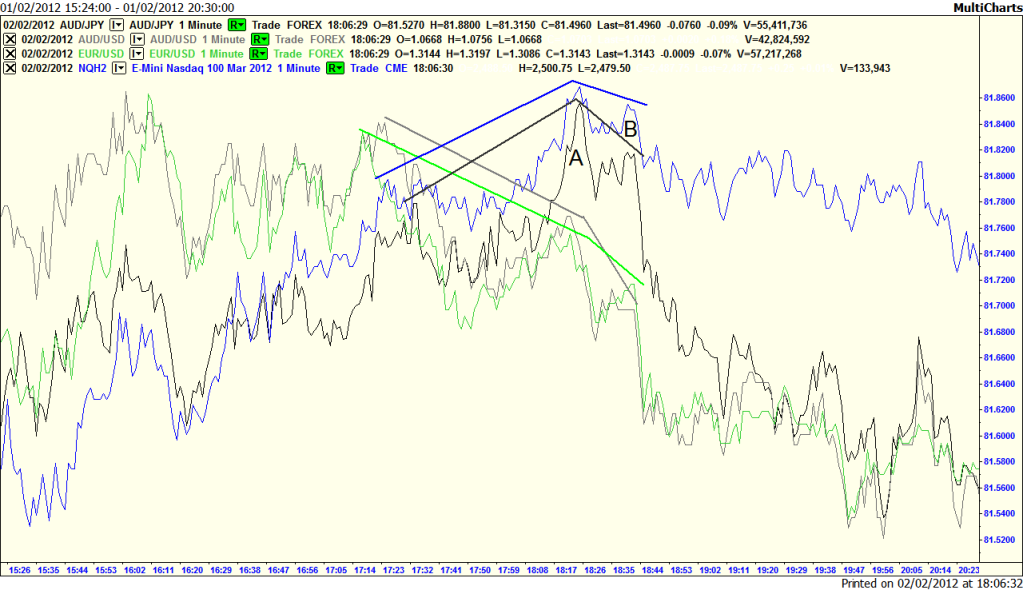
This is a good example showing how the currency markets can lead into turns in the equity markets. At point A EUR/USD and AUD/USD are diverging downward contrary to the trend in NQ, then at point B the EUR/USD and AUD/USD divergence becomes more marked, then 2 minutes later the turn is signalled by AUD/JPY diverging sharply lower and away from NQ. This is the point where the new downtrend in equity markets began this day.
And here with a chart of the NASDAQ over the same timeframe;
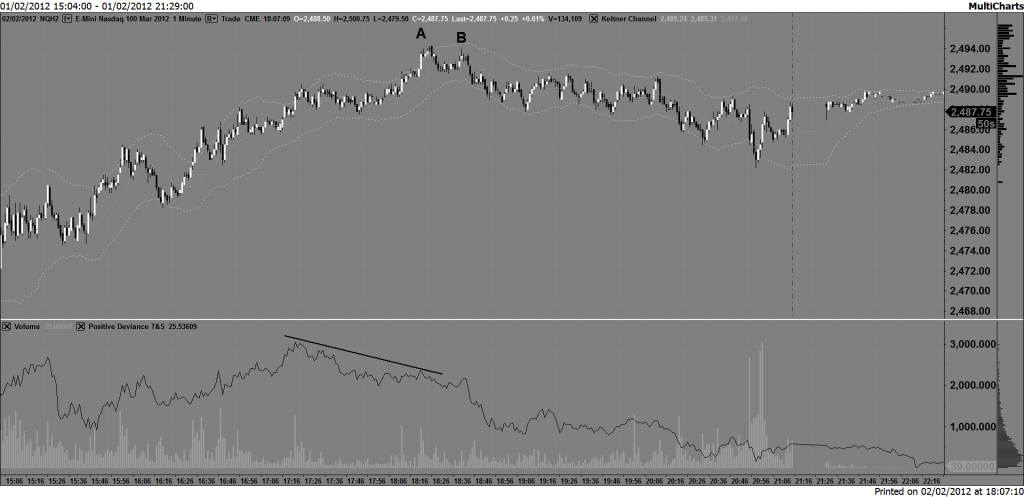
Currency market convergence setup;
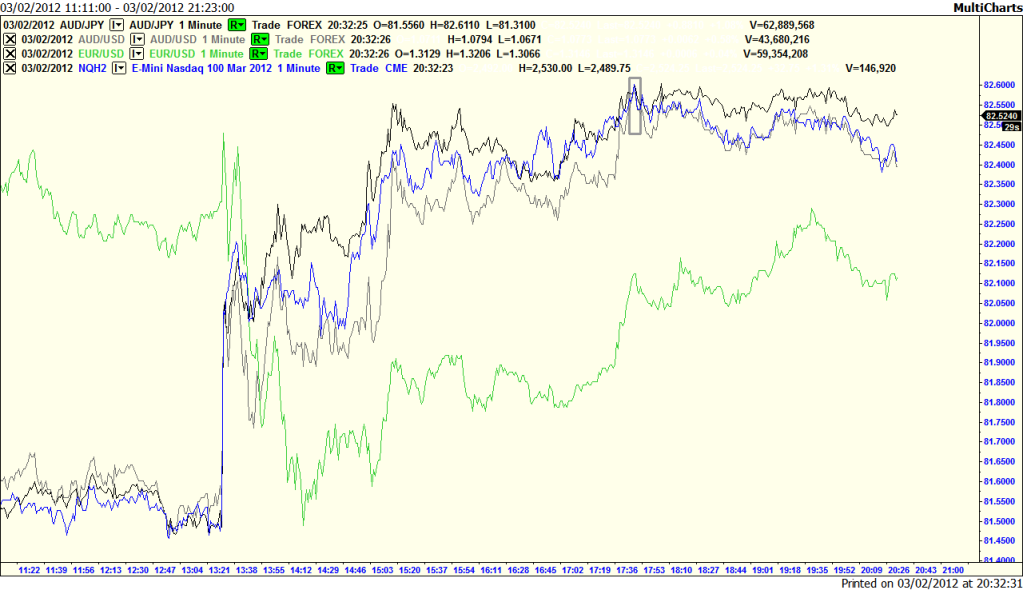
Look at the small rectangle, that's the high of the day. I've seen this a number of times now where 3 of the 4 converge together very tightly to form an upside down "V" at a top or a V at a bottom, I drew this as it happened that day, and went short not long thereafter, 1 point from the high of the day, using this (although that day it didn't work particularly well since there wasn't much of a sell off thereafter). It's almost as if at key points the correlations between the markets themselves make a high or low...
No comments:
Post a Comment