Entry on the NASDAQ;
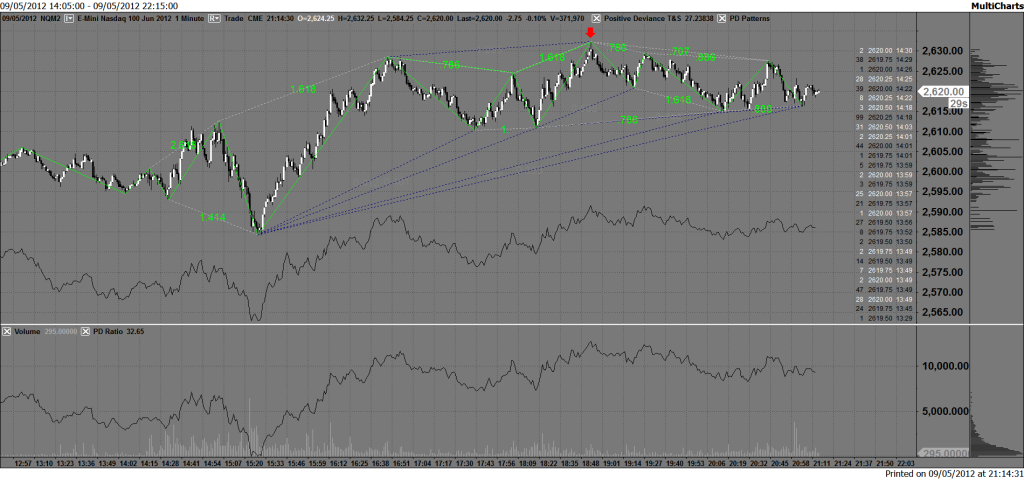
There was a 1.618 retracement of the move lower, that culminated in the completion of a bearish butterfly pattern;

I'd also started looking at these patterns on the dollar index at the same time;
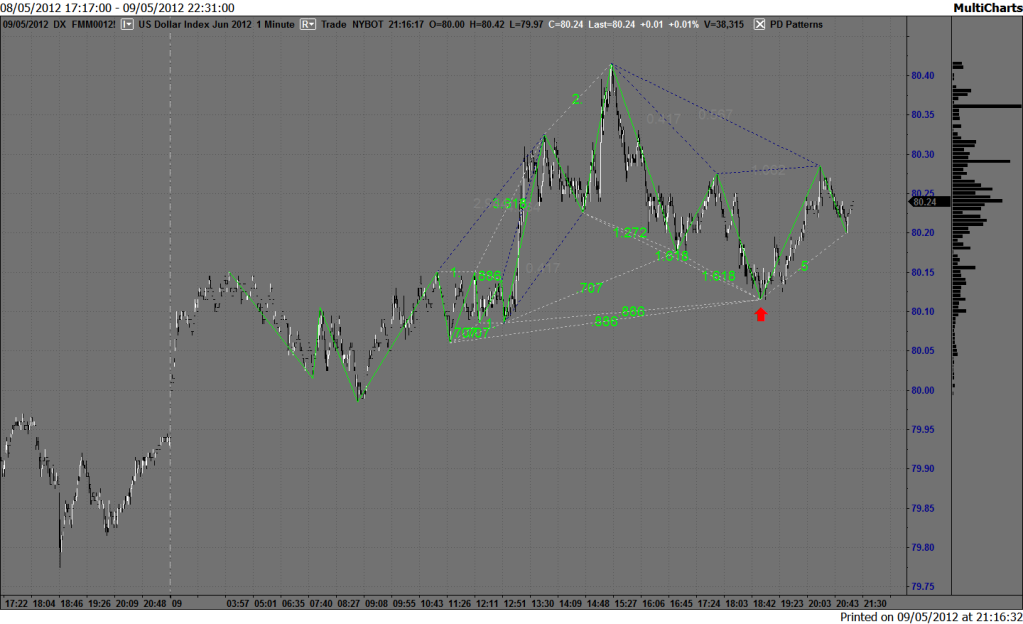
I've highlighted the equivalent point in time on the dollar index chart. What was interesting was that at the completion point for the butterfly, (point D where I entered the trade), the dollar index was at a point where two 1.618 retracements converged, along with two 0.886 retracements. All of these happening at the same time led to the decision to short.
This is approach worth researching further, looking for key retracement levels on the NASDAQ and Dollar Index at the same time.
The great thing about this is that my time can be spent monitoring how the market is developing, looking at the retracement ratios for rational entries, since all of these lines and ratios are automatically calculated and drawn by the system.
No comments:
Post a Comment