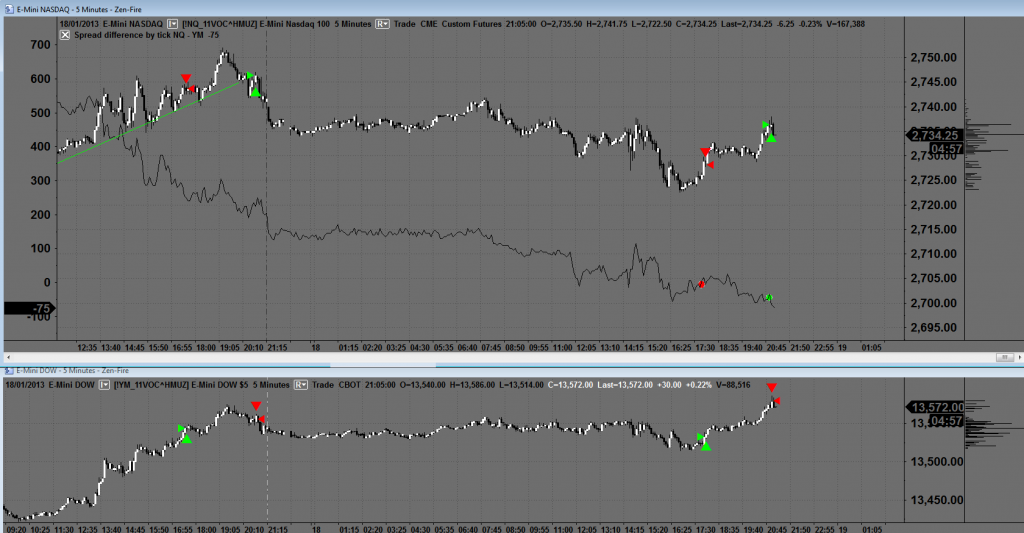
Shorted the NASDAQ 100 Dow Jones spread again today, the trend was down. Typical quiet Friday trading - not much - took a small profit before the close.
Does everyone understand what I'm doing here? Red/Green marker on futures charts (black/white candles) indicates going short/long the future. Whereas the chart in the middle, the black line is the spread between the two. Red marker on that indicates selling the spread, green marker indicates buying it.
No comments:
Post a Comment