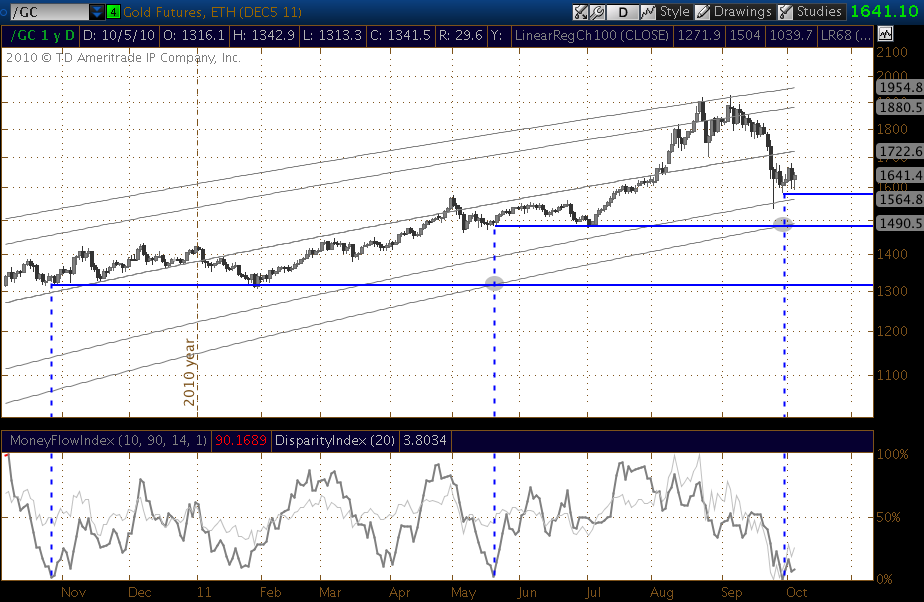
This is gold futures covering 12 months shown within a linear regression trend channel, it's not drawn by me, it's calculated automatically. I've set the regression channel to show the median line, the outermost lines of the channel represent 3 standard deviations from the mean, and the ones inside are 2 standard deviations from the mean. Money Flow Index (MFI) is beneath the chart in dark grey. MFI recently formed a low on 29th September.
The first and second time this indicator bottomed, it marked some form of low in gold. (Blue vertical dashed lines)
Interestingly, you can also see that the price level gold was at, when MFI was at a low, also marked a key support level in gold, with gold trading back down to the same price level later on, then rallying further. (Horizontal blue lines).
What I also find quite interesting is that, on the 2nd and 3rd occasions when the MFI was at a low, the lower 3rd standard deviation line was at the exact price level where MFI made a low previously. (Grey dots show the intersection between the 3rd standard deviation line and previous MFI low gold price)
That may just be a co-incidence and/or confirmation of the strength of the trend.
It seems unlikely but if that relationship were to continue, then gold would rally somewhat from here, before trading down to $1575 by 8th December 2011.
I bought gold earlier today, without having looked at any of this previously.
This next chart is a proprietary indicator I developed, working on GDX (Gold Miners ETF).
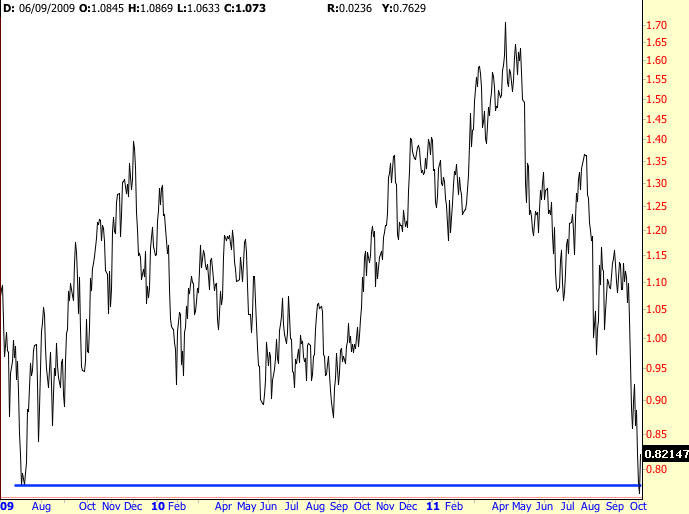
It may look slightly cryptic but it has generated a buy signal for GDX today, previously my indicator signals on GDX have worked well.
No comments:
Post a Comment