Gold futures - 1 year chart non log;
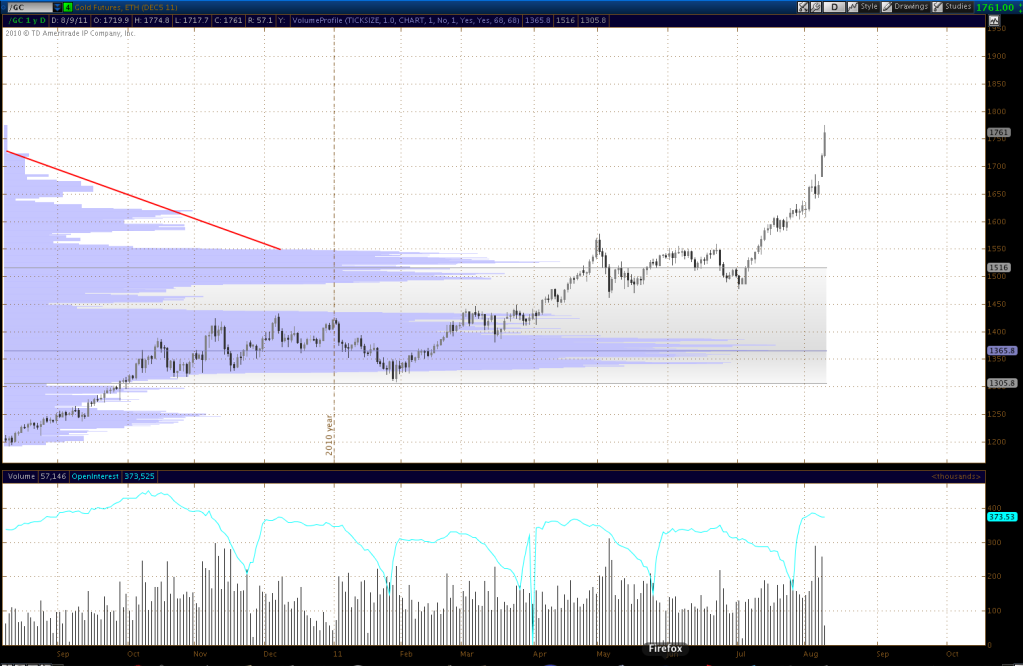
What this chart shows is volume, both in standard format at the bottom of the chart, along with volume plotted in profile across price in blue. The further the blue is to the right of the chart for a given price level, the higher the volume has been at that price level.
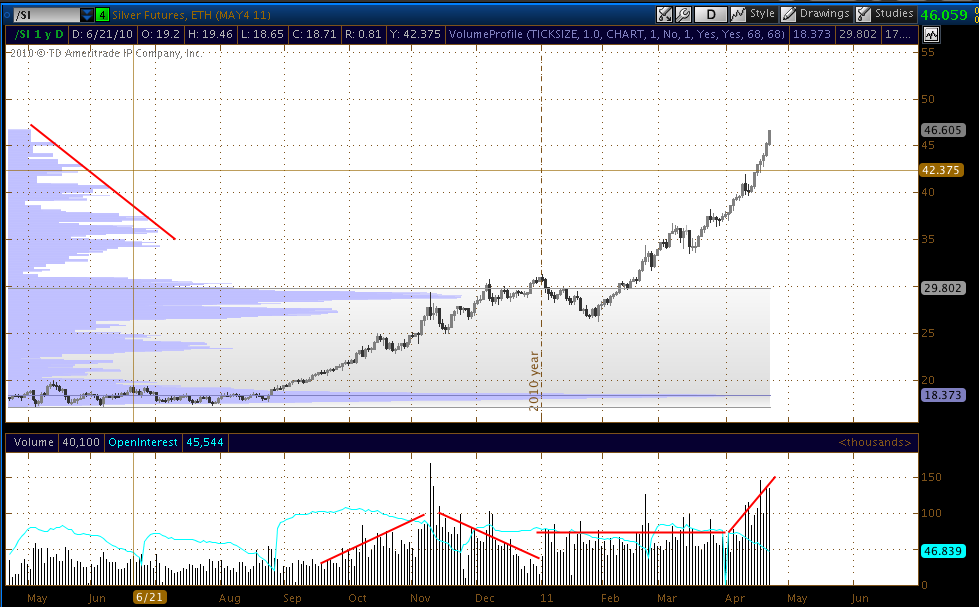
There are similarities between the chart above, and a chart I posted of Silver futures on 21st April this year on the "$50-ish Peak in Silver Coming? Hunting the Top" thread.
Silver futures - 1 year non log (21st April 2011);
On the log chart the move is quite striking.
Gold futures - 1 year log;
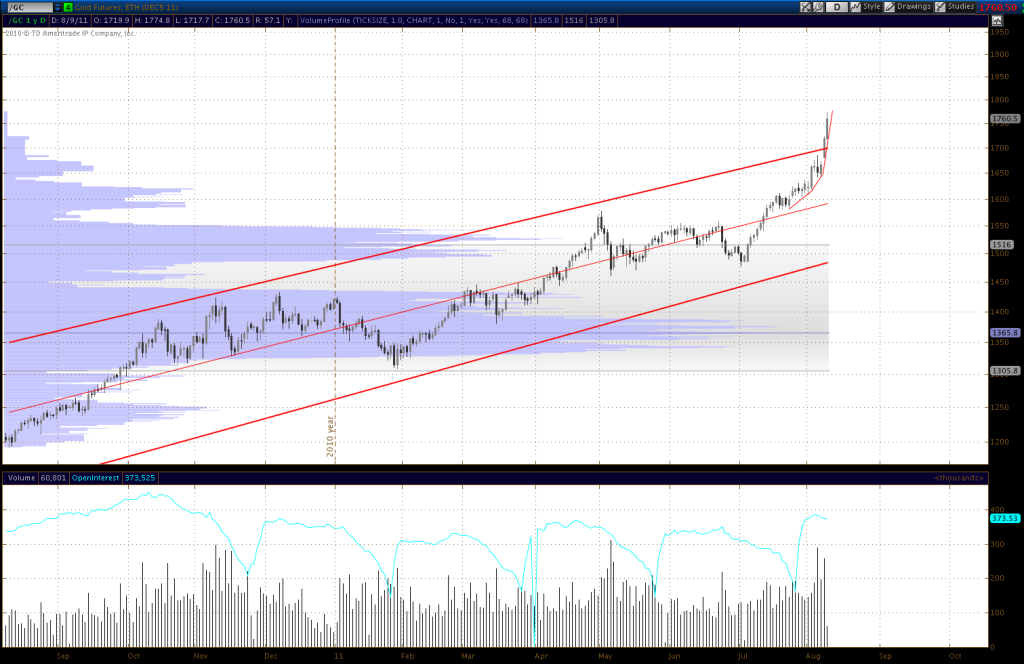
Similarities to the parabola we saw in silver?
CBOE gold volatility;
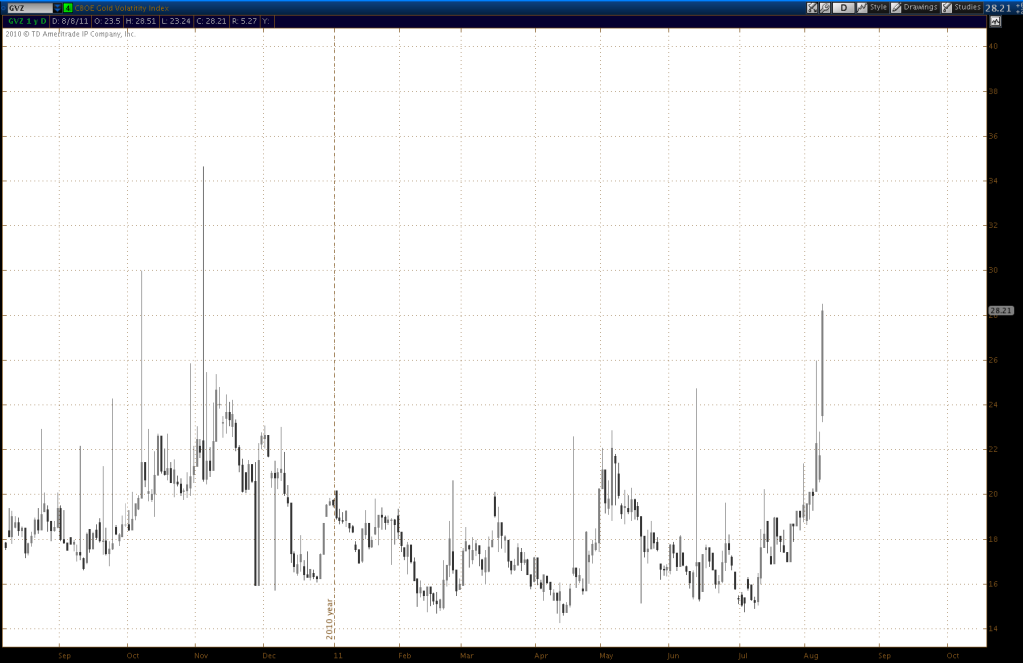
This volatility chart is up to date as of yesterday's close. on 3rd November 2010 Gold volatility spiked to it's high of the year, this preceeded a 5.6% move higher in gold over the following 4 days before a $95 correction.
The GLD/GDX ratio is at the same level as it was during the bottom in stocks on 6th March 2009;
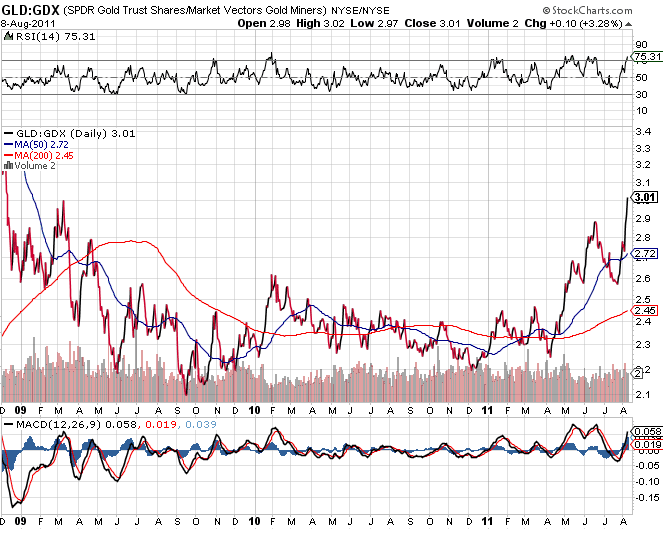
Realistically a $100 correction in gold would not be a surprise given the nature of the rise.
Also;
This is the ratio of (30 year treasury bond futures / E-Mini Gold futures) - 2 year;
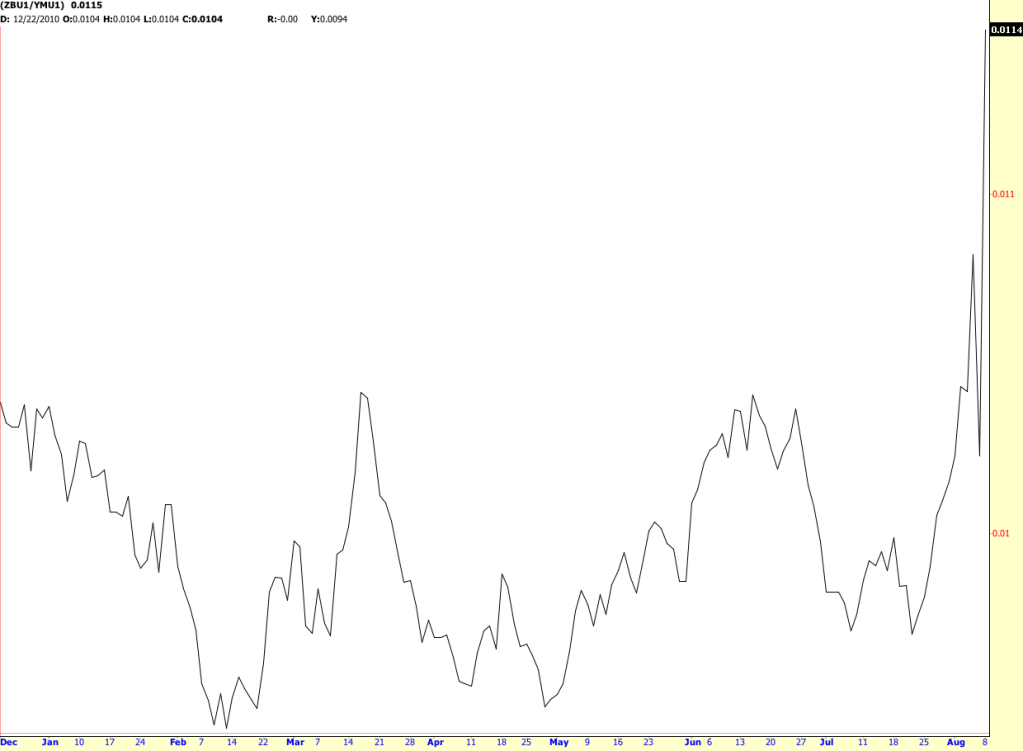
Since the correction in stocks started Gold is massively outperforming 30 year treasuries. Surprise CME margin hikes on gold could temporarily resolve that "problem" for the US Govt.
No comments:
Post a Comment